
Lowe’s Isn’t Home Depot…the Market May Need to Realize That Soon

For homeowners, contractors, and investors, you don’t mention Home Depot without mentioning Lowe’s immediately before, or after.
“Lowe’s and Home Depot” have xyz, or are doing abc, or are great places to go for efg.
But in reality, Lowe’s and Home Depot have had very different performance historically.
Both Home Depot and Lowe’s saw their Uniform ROA bottom out at around 7%-8% in 2010-2011, and both have seen returns recover since then.
But Home Depot has seen returns recover to 26% in FY2019, historic peaks, almost 900bps higher than they were in the prior peak of 2006.
Lowe’s has only seen returns rise to 11% levels in FY2018 and FY2019. That’s still below peak 14% levels in 2006.
A big reason why they have performed differently is Home Depot has been much more diligent about managing their supply chain.
Home Depot has invested significantly in their IT infrastructure to evolve their supply chain, thinking like competitors like Amazon. They have Inventory Days (the # of days of cost of goods sold held in inventory) of 77 days. Lowe’s has Inventory Days of 97 days.
Considering how material inventory investment is in this business, that means a huge swing in necessary investment, which Lowe’s isn’t reaping.
Just as importantly, Lowe’s isn’t sourcing as well as Home Depot is. Generally, companies with similar businesses have similar gross margins and operating margins. But Home Depot’s gross margins are 220bps better than Lowe’s. Their operating margin is a whopping 500bps better than Lowe’s.
But it doesn’t stop there. Lowe’s also has been much less successful in improving PP&E efficiency. For every dollar in investment in building a store they make, they earn less dollars of revenue. And there’s a reason for that.
Contractors will tell you that they significantly prefer to shop at Home Depot. Home Depot gives contractors discount for buying in volume, while Lowe’s is much more geared to the do-it-yourself world. This means Home Depot sees significantly more volume at their stores than Lowe’s does.
Thanks to Home Depot’s thoughtful strategies around supply chain management and targeting key parts of the market to improve revenue opportunities, Home Depot has seen a significantly stronger performance than Lowe’s.
Lowe’s doesn’t appear to be adopting those strategies…and yet the market is pricing Lowe’s to see Uniform ROA rise from 11% to 17%.
The market is pricing Lowe’s like it is following Home Depot’s playbook and going to see an ROA transformation. In reality, management is concerned about their asset efficiency, driving revenue growth, and their capital return initiatives. These factors signal that the market may be too optimistic on Lowe’s, which may mean downside for the stock going forward.
Market expectations are for Uniform ROA to expand to new highs, but management may be concerned about their revenue, efficiency, and capital returns program

LOW currently trades above historical averages relative to UAFRS-based (Uniform) Earnings, with a 26.7x Uniform P/E. At these levels, the market is pricing in expectations for Uniform ROA to expand from 11% in 2019 to 17% in 2024, accompanied by immaterial Uniform Asset shrinkage going forward.
However, analysts have more muted expectations, projecting Uniform ROA to only improve to 12% through 2021, accompanied by 1% Uniform Asset shrinkage.
Historically, LOW has seen cyclical profitability that has yet to reach expected peaks. Uniform ROA improved from 13% in 2004 to a high of 14% in 2006, at the peak of the housing boom in the US, before compressing to a trough of 6% in 2010, due to recessionary headwinds, and steadily rebounding to 11%-12% levels in 2018-2019. Meanwhile, prior to 2009, Uniform Asset growth was robust, ranging from 9%-16% in each year, but has recently been muted, positive in just six of the past 10 years, while ranging from -5% to 5% since 2010.
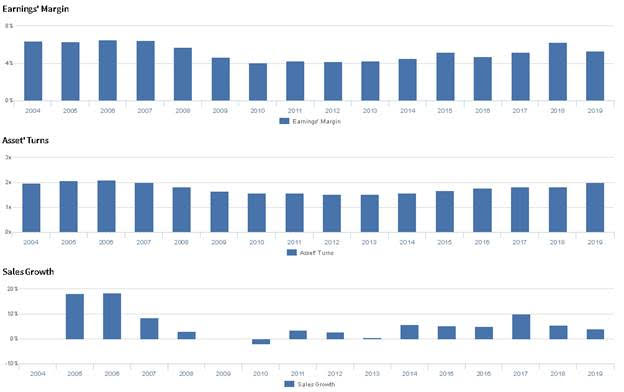
Cyclicality in profitability has been driven by compounding trends in Uniform Earnings Margin and Uniform Asset Turns. Uniform Margins remained at 6%-7% levels from 2004-2007, before compressing to trough 4% levels in 2010-2013, and recovering to 6% in 2018. Since then, Uniform Margins have faded to 5% in 2019. Meanwhile, Uniform Turns, which improved from 2.0x in 2004 to 2.1x in 2006, fell to 1.5x levels in 2012-2013, but have since rebounded to 2.0x in 2019. At current valuations, the market is pricing in expectations for both Uniform Margins and Uniform Turns to expand to new peaks.
Earnings Call Forensics
Valens’ qualitative analysis of the firm’s Q3 2019 earnings call highlights that management is confident they will install their price management system by the end of 2019. However, they may lack confidence in their ability to improve efficiency in their Canadian business and migrate Lowes.com to the cloud by H1 2020. Furthermore, they may be concerned about the sustainability of recent revenue performance, and they may lack confidence in their ability to meet their sales guidance for 2019. In addition, they may lack confidence in their ability to drive operating income through reducing SG&A spend and sustain recent U.S. sales growth. Finally, they may be concerned about the sustainability of their capital returns program, and they may lack confidence in their ability to improve store efficiency.
UAFRS VS As-Reported
Uniform Accounting metrics also highlight a significantly different fundamental picture for LOW than as-reported metrics reflect. As-reported metrics can lead investors to view a company to be dramatically stronger or weaker than real operating fundamentals highlight. Understanding where these distortions occur can help explain why market expectations for the company may be divergent.
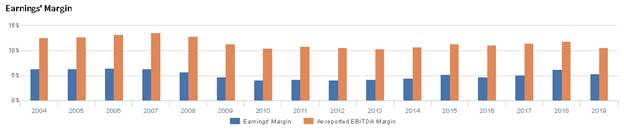
As-reported metrics significantly overstate LOW’s margins, one of the primary drivers of profitability. For example, as-reported EBITDA margin for LOW was 11% in 2019, substantially higher than Uniform Earnings Margin of 5% in the same year. Moreover, as-reported margins have been approximately 2x higher than Uniform Margins in each year since 2004, significantly distorting the market’s perception of the firm’s performance for over a decade.
Today’s Tearsheet
Today’s tearsheet is for Novo Nordisk. Novo Nordisk trades in line with market valuations. The company has recently had mid single-digit Uniform EPS growth. EPS growth is forecast to remain at these levels in 2019 before accelerating in 2020. At current valuations, the market is pricing the company to see no earnings growth going forward.
The company’s earnings growth for 2020 is in line with peers, and the company is also trading at peer average valuations. The company has robust returns, and no risk to their dividend.
Regards,
Joel Litman
Chief Investment Strategist