
Many of the great investors would tell you that poker and investing are close twins, this investor has proven it with his success in both disciplines

This influential hedge fund investor has followed the same rules to become a world class poker player that he used to become a well-known hedge fund star.
Using GAAP as-reported financial metrics, the investments in his fund’s portfolio look like he’s not applying a sound poker strategy.
In reality, UAFRS-based financial metrics help make sense of the stocks he is buying, and how they line up perfectly.
In addition to examining the portfolio, we’re including a deeper look into the fund’s largest current holding, providing you with the current Uniform Accounting Performance and Valuation Tearsheet for that company.
Investor Essentials Daily:
Friday Uniform Portfolio Analytics
Powered by Valens Research
“Poker, of all games, is most like stock investing.” Peter Lynch
“…it’s a matter of patience and discipline—you need them in both investing and poker.” John Rogers (Founder, Ariel Capital)
“You have to look for the market’s tells… when fundamentals change… and prices don’t” Bill Gross
Many great investors say that of all games, poker is the one that is most like investing.
Both require not just a sound knowledge of strategy and math and analysis, but also risk control and an ability to understand what the “other players” are thinking.
Understanding the “other players” means the people across the table from you in poker, and the investors also buying and selling stocks in the market.
In investing, it is not enough just to know what a company is intrinsically worth, it is about understanding when the market will realize that, and without that exactly right set-up, even the best stock idea will fail.
In terms of risk control, it is about understanding how much you should invest, based on your confidence on the other variables above. Not all bets are created equal, in either poker or investing.
One investor who has become particularly famous for his obsession with poker and how he thinks about them both the same has another quote:
“Both poker and investing are games of incomplete information. You have a certain set of facts and you are looking for situations where you have an edge, whether the edge is psychological or statistical.”
He has learned about both at the top level. He’s managed an $8 billion hedge fund. He’s finished in the top 20 in the World Series of Poker main event.
David Einhorn has had a tough few years in terms of investing returns, which have shrunk his portfolio, but he’s still widely respected in both the investing and poker worlds as a sharp value investor who understands how to work within the market.
He applies much of the same strategy to identify stocks to invest in his value approach as he does when playing poker. He focuses on finding places where he has an edge because the market has overreacted psychologically, and he can identify significantly mispriced assets.
This strategy is also why he’s always had a value focus. Identifying companies, often higher quality than the market realizes, that the market misunderstands.
It’s not obvious he’s identifying mispriced ideas looking at as-reported metrics, but when looking at Uniform Accounting metrics, his strategy becomes more apparent.
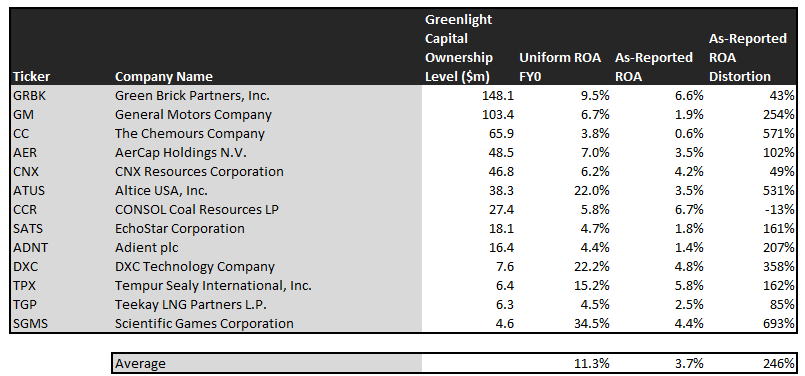
We’ve conducted a portfolio audit of Einhorn’s Greenlight Capital’s top holdings, based on their most recent 13-F.
We’re showing a summarized and abbreviated analysis of how we work with institutional investors to analyze their portfolios.
Unsurprisingly, the companies the fund focuses on appear to not be uncertain poor performing names, like as-reported metrics reflect. In reality they appear to be higher quality names, once Uniform Accounting metrics are reviewed.
This type of misunderstanding and mispricing, as Einhorn likes to talk about, is likely part of what makes these names interesting to his fund.
See for yourself below.
Using as-reported accounting, investors would think Greenlight is buying distressed names and betting on a deep value strategy, solely focused on markets reacting when fundamentals rebound.
To use a poker term, it looks like he’s holding a bad hand, waiting to be bailed out on the river (to have the cards rescue his bet), which isn’t how a smart investor invests.
On an as-reported basis, many of these companies are poor performers with returns below 7%, and the average as-reported return on assets (ROA) is only 4%.
In reality, the average company in the portfolio displays an impressive average Uniform ROA at 11%. That’s roughly in line with the current corporate average returns.
Once we make Uniform Accounting (UAFRS) adjustments to accurately calculate earning power, we can see that the returns of the companies in Greenlight’s portfolio are much more robust.
Once the distortions from as-reported accounting are removed, we can realize that Altice USA, Inc. (ATUS) doesn’t have a 4% ROA, it is actually at 22%. Altice is a strongly profitable cable company and is generating returns well above peer levels.
Similarly, DXC Technology Company’s (DXC) ROA is really 22%, not 5%. While as-reported metrics are overly punishing the company for accounting noise related to acquisitions, Uniform Accounting sees its strong profitability and visibility of earning power.
Scientific Games Corporation (SGMS), another of Greenlight’s positions, is another great example of as-reported metrics mis-representing the company’s profitability.
Scientific Games doesn’t have a 4% ROA, it is actually at 35%. EInhorn appears to understand that market expectations for the company, thinking its a low-return business, is completely incorrect.
The list goes on from there, for names ranging from Tempur Sealy International, Inc. (TPX) and Adient plc (ADNT), to EchoStar Corporation (SATS), CNX Resources Corporation (CNX), and General Motors Company (GM).
If Greenlight was focused on as-reported metrics, it would never pick most of these companies because they look like bad companies and poor investments to predict inflections for.
But to find companies that can deliver alpha beyond the market, just finding companies where as-reported metrics mis-represent a company’s real profitability is insufficient.
To really generate alpha, any investor also needs to identify where the market is significantly undervaluing the company’s potential. This is especially true for a value investor like Einhorn.
Greenlight is also investing in companies that the market has low expectations for, low expectations the companies can exceed.

This chart shows three interesting data points:
- The 2-year Uniform EPS growth represents what Uniform earnings growth is forecast to be over the next two years. The EPS number used is the value of when we take consensus Wall Street estimates and we convert them to the Uniform Accounting framework.
- The market expected Uniform EPS growth is what the market thinks Uniform earnings growth is going to be for the next two years. Here, we show by how much the company needs to grow Uniform earnings in the next 2 years to justify the current stock price of the company. If you’ve been reading our daily and our reports for a while, you’ll be familiar with the term embedded expectations. This is the market’s embedded expectations for Uniform earnings growth.
- The Uniform EPS growth spread is the spread between how much the company’s Uniform earnings could grow if the Uniform earnings estimates are right, and what the market expects Uniform earnings growth to be.
The average company in the US was forecast to have 5% annual Uniform Accounting earnings growth over the next 2 years before the coronavirus outbreak. Greenlight’s holdings are forecast by analysts to outpace that, growing at a robust 37% a year the next 2 years, on average.
But Greenlight is not just finding high quality, higher growth companies though—it is finding mispriced companies.
On average, the market is pricing these companies to shrink earnings by 5% a year. While these companies are growing robustly, they are intrinsically undervalued, as the market is mispricing their growth by 42% on average!
These are the kinds of companies that are likely to see their stocks rally when the market realizes how wrong it is. When the mispricings resolve as the market goes from having incomplete information to the real information on the company.
Without Uniform numbers, the GAAP numbers would leave everyone confused.
One example of a company in the Greenlight portfolio that has growth potential that the market is mispricing is Green Brick Partners Inc. (GRBK), Greenlight’s largest holding. Green Brick’s Wall Street analyst forecasts have 8% Uniform earnings growth built in, but the market is pricing the company to have earnings shrink by 9% each year for the next two years.
Another company with similar dislocations is TPX. Expectations may look high with market expectations for a 11% growth in earnings. However the company is actually forecast for Uniform EPS to grow by 40% a year. While expectations are high, if it can deliver higher growth, there’s more upside.
Yet another one of the fund’s largest holding, The Chemours Company (CC), is priced for flat Uniform earnings the next few years, when the company is forecast to grow earnings by 69% a year.
That being said, there are a few companies we’d recommend Greenlight to look at again before holding.
CNX is forecast to see Uniform earnings shrink by 38% a year going forward, however the market is pricing the company for only 12% annual earnings growth.
This doesn’t look like an intrinsically undervalued company. If anything, the market looks significantly too bullish.
But many of Greenlight’s holdings look like a high quality, undervalued set of stocks with businesses displaying strong earning power. It wouldn’t be clear under GAAP, but unsurprisingly, Uniform Accounting sees the same signals that Greenlight appears to.
Green Brick Partners, Inc. Limited Tearsheet
As Greenlight Capital’s largest individual stock holding, we’re highlighting Green Brick’s tearsheet today.
As our Uniform Accounting tearsheet for Green Brick Partners, Inc. (GRBK) highlights the company’s Uniform P/E trades at 10.0x, which is below corporate average valuation levels and its own recent history.
Low P/Es require low—and even negative—EPS growth to sustain them. In the case of Green Brick, the company recently had a high Uniform EPS growth of 43%.
While Wall Street stock recommendations and valuations poorly track reality, Wall Street analysts have a strong grasp on near-term financial forecasts like revenue and earnings.
As such, we use Wall Street GAAP earnings estimates as a starting point for our Uniform Earnings forecasts. When we do this, we can see that Green Brick is forecast to only see Uniform EPS of 5% in 2019 followed by 10% in 2020.
Based on current stock market valuations, we can back into the required earnings growth rate that would justify $11 per share. These are often referred to as market embedded expectations.
In order to meet the current market valuation levels of Green Brick, the company would have to shrink Uniform EPS growth by 9% each year over the next three years.
What Wall Street analysts expect for Green Brick’s earnings growth is far above than what the current stock market valuation requires.
Furthermore, the company’s earnings power is 2x corporate averages, signaling that there is somewhat stable cash flow risk to the company’s operations and credit profile in the future.
To conclude, Green Brick’s Uniform earnings growth is higher than peer averages in 2019. Also, the company is trading below peer valuations.
Best regards,
Joel Litman & Rob Spivey
Chief Investment Strategist &
Director of Research
at Valens Research


