
One of the Greatest Hedge Fund Managers Ever Lost His Investors More Than He Ever Made Them

In March 2000, Julian Robertson made the decision to return all Tiger Management’s investors’ money. He shut down the hedge fund.
One of Tiger’s funds, the Jaguar Fund, had dropped 14% in the first 2 months of the year, having lost almost 18% since late 1998. After a $2 billion loss on a bad bet in the Japanese yen in 1998, Tiger had steadily seen investors leaving, and taken on losses, seeing the firm’s AUM drop from $20 billion in 1998 to $6.5 billion at the time Robertson decided to close the doors.
Robertson and Tiger had been one of the early stars of the hedge fund world. He took $8 million in capital in 1980 and turned it into over $20 billion by the fund’s 1998 peak.
But Robertson was too early to the party of shorting internet stocks. His dogmatic value-based philosophy on investing led him to be long old-economy companies in the late 1990s, in the face of a rampant growth-focused bull market.
It meant that when he reached his peak in AUM, that was just when he started losing money. And because of that timing, many have said he actually lost more money for investors than he ever made them in the prior 18 years.
Ironically, March 2000, when Tiger threw in the towel, was the market peak, and Robertson ended up being proven right.
He made plenty of money after 2000, as he remained short the internet bubble with his own money, but his investors never got to participate.
But that’s not the most important thing that came out of Tiger Management. The most important thing was the group of investors that Robertson mentored at Tiger, and sponsored to grow after Tiger’s demise.
He had built an all-star team at Tiger. They matured under him at Tiger, absorbing his deep fundamental research perspective. Importantly, with his help, they also learned his mistakes in the dot-com bubble, and understood the importance of timing their investments to avoid being right too soon as Robertson had been.
In the aftermath of the dot-com bubble, Robertson sponsored several of his former employees setting up their own hedge funds. He would provide them with initial capital for a stake in their fund. He would continue to mentor them. And he would help them create a network of Tiger Cubs, that would share ideas and research, much like they had inside of Tiger Management, to maximize returns.
These great investors include brand names like Samlyn, Maverick, Lone Pine, HealthCor, and Coatue. Hedge funds that are amongst the most respected investors today.
However, most would agree the most successful, and largest, of the tiger cubs is Chase Coleman and his Tiger Global.
Coleman and Tiger Global follow in Robertson’s fundamental research driven footsteps. Their strategy is not as simple as focusing just on value companies, like Klarman at Baupost, or growth companies, like Driehaus. Their goal is to find great thematic ideas that are mispriced by the market, which can run the gamut of deep value, value, GARP, and growth names, depending on the market context.
When looking at Tiger Global’s holdings, anyone using as-reported accounting metrics would likely be scratching their heads. Coleman and his firm are focused on the true fundamentals of companies when they are looking for mispriced firms. Using traditional as-reported accounting metrics, the fundamentals and KPIs for businesses don’t line up with the accounting. It is only once those holdings are looked at with a lens that better represents economic reality, and lines up with the KPIs and real fundamentals, that their investments become apparent.
To show what we mean, we’ve done a high level portfolio audit of Tiger Global’s top holdings, based on their most recent 13-F. This is a very light version of the custom portfolio audit we do for our institutional clients when we analyze their portfolios for torpedos and companies they may want to “lean in” on.
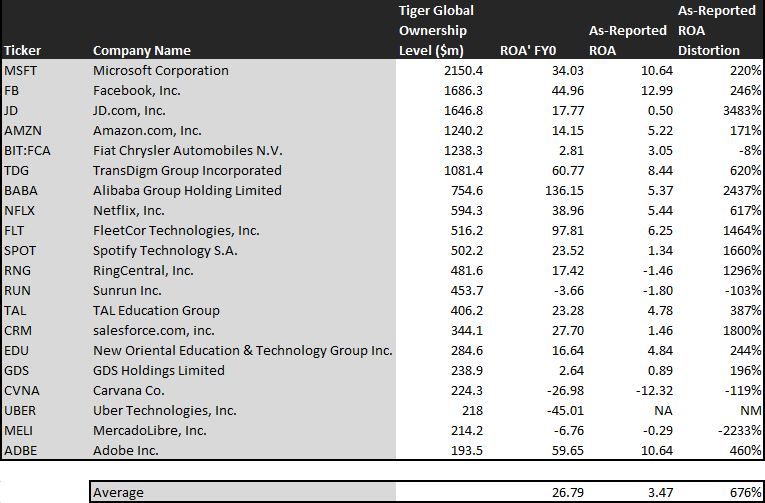
Using as-reported accounting, investors would be scratching their heads at the companies that Tiger Global owns. These don’t look like companies with strong fundamental tailwinds that are ready to unlock significant value. The average company in their holdings has a sub 5% ROA on an as-reported basis. Several of their companies have negative ROAs.
But once we make Uniform Accounting (UAFRS) adjustments, we realize that the returns of the companies in Tiger Global’s portfolio are much more robust. Once we make these adjustments, the average company has a 27% adjusted ROA. Companies like RingCentral (RNG) don’t have a -1% ROA, they have a 17% adjusted ROA, robust profitability. Amazon’s (AMZN) ROA isn’t 5%, it is 14% and rising. Their investments in JD.com (JD) and Alibaba (BABA) make sense, as these companies don’t have 5% or below ROA, JD.com’s ROA is 18%, and Alibaba’s is a phenomenal 136%.
If Tiger Global was looking at as-reported metrics, they might be concerned that the accounting metrics are warning them that the fundamental tailwinds they think they are seeing aren’t actually producing. For the average company, as-reported ROA understates profitability by almost 90%. Uniform ROA is 670% higher than the distorted as-reported metrics.
That being said, there are some companies that Tiger Global might be betting on that aren’t actually seeing the fundamental tailwinds they think they’re seeing. Uniform Accounting shows these companies are poor performing companies that may not turn out to be winners.
Two that jump out are Carvana, who doesn’t have a -12% ROA, they have a -27% return, and Fiat who is still a below cost-of-capital return business, even after making Uniform Accounting adjustments.
On a Uniform Accounting EPS growth perspective, Tiger Global’s ideas look a bit more conflicted. Some of the names look significantly undervalued, while others look overvalued. But this makes sense, when you look at it in the context of their strategy. Often they are attempting to identify companies with key value opportunities being unlocked that even sell-side analysts are not fully capturing yet. Since forecasted EPS growth is based off of adjusted analyst estimates, it would make sense that if analysts haven’t spied the inflections, these names wouldn’t all look great.
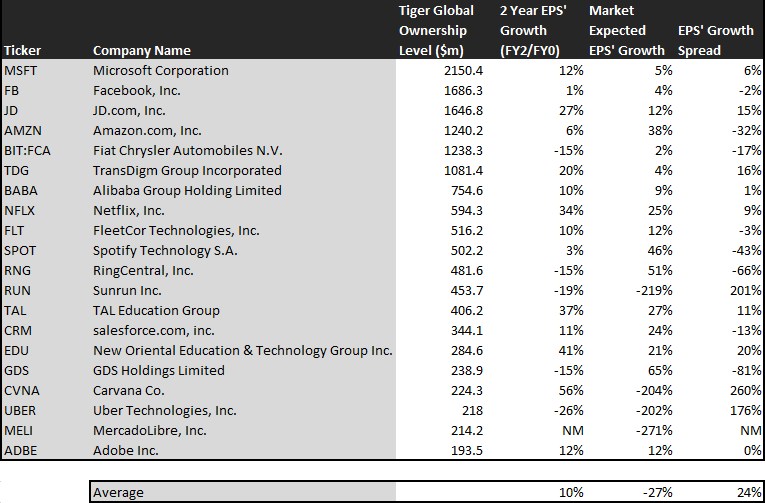
This chart shows three interesting datapoints:
- The first datapoint is what earnings growth is forecast to be over the next two years, when we take consensus Wall Street estimates, and we convert them to the Uniform Accounting framework. This represents the earnings growth the company is likely to have in the next two years
- The second datapoint is what the market thinks earnings growth is going to be for the next two years. Here we are showing how much the company needs to grow earnings by in the next 2 years, to justify the current stock price of the company. If you’ve been reading our daily and our reports for awhile, you’ll be familiar with the term embedded expectations. This is the market’s embedded expectations for earnings growth
- The final datapoint is the spread between what the company could do, if the Uniform Accounting adjusted Wall Street estimates are right, and what the market expects earnings growth to be
The average company in the US is forecast to have 5% annual Uniform Accounting earnings growth over the next 2 years. Tiger Global’s holdings are forecast to outpace that, growing at 10% a year the next 2 years, on average. They are definitely identifying companies that have tailwinds to drive growth.
On average, the market is pricing these companies to shrink earnings by 27% a year, so it is also identifying companies that are skewed negatively. However, the median company in this portfolio only has a 1% mispricing between forecasted earnings growth and what the market is pricing in.
If analysts are right about these companies, then they are fairly valued on average. Some of them are significantly undervalued, but others appear to be overvalued. What Tiger Global is betting is they know more than the analysts and market do, and these companies will exceed analyst expectations.
If the market is already pricing the average company in the portfolio to do what analysts expect it to do, and the company exceeds expectations, Tiger Global will be rewarded.
A good example of this is FleetCor (FLT). FleetCor’s Uniform Accounting earnings growth is forecast to be around 10% a year going forward. The market is pricing the company for 12% Uniform EPS growth, so if analysts are right, the company is fairly valued. Similarly, Alibaba is priced for 9% EPS growth, and Uniform EPS growth is forecast to be 10%.
There are several names that look materially mispriced even if they just meet analyst expectations. Examples include TransDigm (TDG), which is priced for 4% growth, but forecast to have 20% EPS growth. Similarly, New Oriental Education (EDU) is priced for 21% EPS growth, but they’re forecast for much stronger 41% EPS growth.
On the other hand, there are some names that look like they might be fairly valued at best, even if Tiger Global was right, and analysts are wrong, because market expectations are already so high. Amazon is an example of this, with modest 6% EPS growth forecast the next 2 years, versus market expectations for 38% growth. Similarly, GDS Holdings (GDS) is priced for 65% growth, but analysts are forecasting -15% EPS growth. Even if analysts are wrong about GDS, upside is likely limited.
However, for the most part, Tiger Global is positioned how they want to be. They are positioned in names with winds at their back, strong economic moats. They’re also positioned where they want to be, companies that are mispriced if Tiger knows more than the analysts that cover them do, which is where they make their bread and butter.
Just like Robertson, Coleman is comfortable betting against the market, and uncovering unique value. And Uniform Accounting analysis confirms it.
We’re Relaunching Our Portfolio Audit Review Offering – And Making A Special Offer
For our institutional clients, we don’t just provide access to our Valens Research app. We also do bespoke research. We produce one-off deep-dive company analyses using all our tools, including Uniform Accounting, credit work, and our management compensation and earnings call analysis. We monitor their portfolios for potential Uniform Accounting signals to alert them. We provide custom datasets for quantitative analysis, and provide aggregate analytics. We also help them create unique idea generation screens that are customized to their approach, using Uniform Accounting and our other analytics.
But for most of our institutional clients, the analysis that they find most useful, and almost universally ask for, is a quarterly portfolio audit and call with our analysts.
Our institutional clients pay a significant premium for all our bespoke research. Some of our institutional clients have paid well over $100,000 a year for our uniquely tailored Uniform Accounting research, because of the value it adds to their process.
Until Thanksgiving, we’re making a special offer.
For any investor that buys access to the Valens Research app ($10,000/year subscription), we will include an Institutional-level portfolio audit and call with our analyst team with no extra charge.
Also, for those people who sign up to the offer before November 1st, we’ll include lifetime access to all of our newsletters, including our Market Phase Cycle™ and Conviction Long Idea List (a $6,000 value), for no extra charge, for as long as you remain a Valens Research app subscriber.
We want to help show you how powerful Uniform Accounting research can be for your investment strategy.
If you want to hear more about this offer, or are interested in subscribing, feel free to reply to this email. I’ll forward on your note to our head of client servicing. Or, feel free to reach out to Doug Haddad, the head of our client relations team, at doug.haddad@valens-securities.com or at 630-841-0683.
To read more about the offer and sign up, you can also click here – and read about another investing great, Seth Klarman.
Today’s Tearsheet
Today’s tearsheet is for UnitedHealth Group. UnitedHealth trades at a discount to the market. At current valuations, the market expectations are for negative Uniform EPS growth, while the company has historically grown strongly, and is forecast for this to continue. The company’s forecast earnings and valuations are both superior to peers, implying the company is a better investment than their peer group overall. The company also has robust profitability and no risk to its dividend yield.
Regards,
Joel Litman
Chief Investment Strategist