
Passive investing is about getting factor exposure, however, if you buy this “Value” fund, UAFRS shows you’ll get anything but value stocks

Many investors today do not have the time or resources to search for individual value stocks to buy. This is why they invest in ETFs either exposed to the entire market or a broad theme.
For these investors, getting exposure to a value index eliminates the hassle of looking for these companies and has limited fees. For investors looking to get exposure to value stocks, they can turn to this specific index fund.
In addition to examining the portfolio, we are including a deeper look into the fund’s largest current holding, providing you with the current Uniform Accounting Performance and Valuation Tearsheet for that company.
Investor Essentials Daily:
Friday Uniform Portfolio Analytics
Powered by Valens Research
Sometimes, names can be misleading. The names of objects, animals, or events might imply one thing, but are actually completely unrelated due to quirks of language or past history.
For example, a firefly is not actually a fly. Fireflies are a family of insects in the beetle order. Likewise, prairie dogs are not actually dogs. They are burrowing rodents, with almost no resemblance to traditional domestic dogs.
Sometimes, turns of phrases once correct stay in use despite becoming incorrect in the current period. Everyone says pencils contain lead, when in reality they contain graphite. Lead has not been used in writing utensils for hundreds of years, due to the health risks posed. In the early 1500s, a massive deposit of graphite was discovered, introducing the world to modern day writing utensils. However, chemistry was still in its infancy at the time, and people believe that graphite was a type of lead, leading to the misnomer.
It is important to not take everything at face value, but to test and conduct further research. This maxim can also be applied to investing. Particularly with the categorization of “value” and “growth” stocks.
Value investing generally refers to searching for stocks that are trading for less than intrinsic value. These companies are often beaten down and trading for bargain prices. Traditional metrics used to identify these companies are the price-to-earnings ratio (P/E) and price-to-book ratio (P/B). These metrics measure the company’s earnings relative to stock price, and the book value of assets compared to its market capitalization respectively.
On the other hand, growth investing refers to purchasing stocks with above-average growth, even if the share price might seem expensive based on traditional metrics. These companies rarely pay dividends, instead opting to invest in the business.
However, both of these categories can often be mislabeled, much like the names of lead pencils or fireflies. It becomes particularly murky when looking for these companies using traditional, as-reported metrics. Distortions caused by improper accounting of goodwill, R&D expense, excess cash, and others, can warp investors’ perception of what kind of stock they are looking at.
A growth stock could look like a company with negligible increases due to the overstating of a firm’s expenses. Likewise, a value stock might appear expensive due to the artificial inflation of a company’s asset base, or decrease in earnings due to poor accounting. This can lead to investors misidentifying stocks and pursuing the wrong companies for their investment style.
With that in mind, we wanted to take a look at one of the big “style” indices, the S&P 500 value (SVX). The index breaks up the S&P 500 into companies considered value stocks, based on book value, earnings, and sales to price metrics.
Despite the S&P 500 value index’s focus on buying companies considered value stocks, looking at the index paints a different picture. Using as-reported metrics, it appears the index is just investing in low-return companies, though they may be cheap.
Using Uniform Accounting, we can see if the companies in this index are actually higher-quality names. However, after the accounting noise is removed, they might not be cheap, they might just be low growth.
See for yourself below.
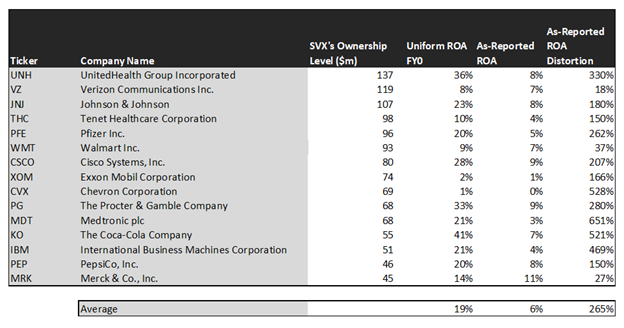
Looking at as-reported accounting, investors would think buying into the SVX ETF would lead to losing out on investment potential.
On an as-reported basis, many of these companies are poor performers with returns below 10%, with the average as-reported return on assets (ROA) right around 6%.
In reality, the average company in the index displays an impressive average Uniform ROA of 19%.
Once we make Uniform Accounting (UAFRS) adjustments to accurately calculate earnings power, we can see the underlying strength of investing in the S&P 500 value index.
Once the distortions from as-reported accounting are removed, we can see Medtronic (MDT) does not have an average return of 3%, but a sizable ROA of 21%.
Similarly, Coca-Cola’s (KO) ROA is really 41%, not at 7%. While as-reported metrics are portraying the company as slightly above cost-of-capital, Uniform Accounting shows the company’s truly robust operations.
United Health (UNH) is another great example of as-reported metrics misrepresenting the company’s profitability. It doesn’t have an 8% ROA, it is actually at 36%.
The list goes on from there, for names ranging from Pfizer (PFE) and Procter & Gamble (PG) to Johnson & Johnson (JNJ) and PepsiCo (PEP).
If investors were to only look at as-reported metrics, they would assume value investing means accepting exposure to companies with below-average returns. In reality, these companies have huge returns.
Now, let us see how these firms’ are value companies, with undervalued EPS growth and Uniform P/E (V/E’) to see if the index is focusing on the companies it claims to be focusing on.

This chart shows three interesting data points:
- The 2-year Uniform EPS growth represents what Uniform earnings growth is forecast to be over the next two years. The EPS number used is the value of when we take consensus Wall Street estimates and we convert them to the Uniform Accounting framework.
- The market expected Uniform EPS growth is what the market thinks Uniform earnings growth is going to be for the next two years. Here, we show by how much the company needs to grow Uniform earnings in the next 2 years to justify the current stock price of the company. If you’ve been reading our daily analyses and reports for a while, you’ll be familiar with the term embedded expectations. This is the market’s embedded expectations for Uniform earnings growth.
- The Uniform EPS growth spread is the spread between how much the company’s Uniform earnings could grow if the Uniform earnings estimates are right, and what the market expects Uniform earnings growth to be.
The average company in the U.S. is forecast to have 5% annual Uniform Accounting earnings growth over the next 2 years. On the other hand, these stocks are forecasted by analysts to have a 4% growth.
On average, the market is pricing these companies to grow earnings by 2% a year. This highlights that by buying these names, investors aren’t exactly buying “value” stocks, they’re buying companies that have low earnings growth and are expected for that to continue.
However, that doesn’t mean there are not still interesting growth opportunities within SVX.
One example of a company with high growth potential is Tenet Healthcare (THC). While the market expects Tentet to shrink by 1% over the next two years, analysts forecast the firm to see 74% growth over the same period.
Another company with similar dislocations is Medtronic. The company is forecast for Uniform EPS to grow by 21% a year, while the market is expecting the company to only grow EPS by 7%.
That being said, there are some companies forecast to have earnings growth less than market expectations. For these companies, like Walmart (WMT), Chevron (CVX), and PepsiCo, the market has growth expectations in excess of analysts’ predictions.
In addition, we can look at the company’s Uniform earnings or V/E’ to see if the SVX is actually buying cheap stocks. The market average V/E is 21x, which is exactly what the average V/E is for the top 15 stocks in SVX. This would imply that the fund is not actually buying cheap companies relative to traditional ratio analysis after a closer look through Uniform numbers.
In conclusion, traditional value stocks may not always be cheap companies, as traditional ratios like P/E and P/B can be clouded by accounting distortions.
The SVX fund might look like an easy way for investors to get exposure to underappreciated names in the S&P 500. In reality, it is just a way to buy mature low growth, high return companies are market average multiples, making it much less compelling for investors looking for exposure to the “value” factor.
SUMMARY and UnitedHealth Group Incorporated Tearsheet
As S&P 500 Value ETF’s largest individual stock holding, we’re highlighting UnitedHealth’s tearsheet today.
As the Uniform Accounting tearsheet for UnitedHealth highlights, the Uniform P/E trades at 16.3x, which is below global average valuation levels, but around its historical average valuations.
Low P/Es require low EPS growth to sustain them. In the case of UnitedHealth, the company has recently shown a 12% Uniform EPS growth.
Wall Street analysts provide stock and valuation recommendations that in general provide very poor guidance or insight. However, Wall Street analysts’ near-term earnings forecasts tend to have relevant information.
We take Wall Street forecasts for GAAP earnings and convert them to Uniform earnings forecasts. When we do this, UnitedHealth’s Wall Street analyst-driven forecast is 13% and 10% Uniform EPS growth in 2020 and 2021, respectively.
Based on current stock market valuations, we can use earnings growth valuation metrics to back into the required growth rate to justify UnitedHealth’s $303 stock price. These are often referred to as market embedded expectations.
The company needs to grow its Uniform earnings by 3% each year over the next three years and to justify current stock prices. What Wall Street analysts expect for UnitedHealth’s earnings growth is above what the current stock market valuation requires in 2020 and 2021.
Furthermore, the company’s earning power is 6x the corporate average. Also, cash flows are 4x above their total obligations—including debt maturities, capex maintenance, and dividends. Together, this signals a low dividend risk.
To conclude, UnitedHealth’s Uniform earnings growth is above peer averages in 2020 and trading below average peer valuations.
Best regards,
Joel Litman & Rob Spivey
Chief Investment Strategist &
Director of Research
at Valens Research