
Sprint Predicted This Supplier’s Doom

In 2009, we knew Palm was doomed.
For most of you, if you remember Palm at all, you remember it because of the Palm Pilot. The handheld personal device that was about 15 years ahead of its time. It basically created the market that is now the tablet and smart phone market. While they were popular, they never truly took off because this was before cellular data was even a thing. So they were calendar and note takers, more than anything else.
Palm was mostly a niche business, and because of that, it was never exceptionally profitable. When we looked at it on a Uniform Accounting basis, the company’s returns never exceeded 10%-15%, and more often than not, they were below 5%, and often negative.
But in 2008, the company bet the farm on moving into the smart phone market. They invested massively to enter the market to compete with Blackberry and the iPhone, and to finally claim the market share in this space that was rightfully theirs, as the creator of the market. Their new Pixi smartphone was going to revolutionize the business when it came out in 2009.
The company would tell anyone who would listen how the Pixi was going to be a blockbuster, and it was going to sell strong for the holiday season in 2009.
The market believed it. The company, which previously had almost never traded at a significant multiple to book assets, was now trading at 4x adjusted UAFRS assets. The market was pricing the company to see returns rise to 20%+ levels, when the company had never seen returns that high in their history.
But our research told us that was never going to happen, and if it didn’t, Palm was going to a zero.
For Palm to get to the returns the market was expecting, the Pixi needed to be the most popular phone in the 2009 holiday season. But a simple call to Palm’s distribution partner, Sprint, told us that was never going to happen.
We talked to Sprint management ahead of the launch, and they expressed concerns about Palm’s ability to ramp up Pixi supply, ahead of the launch. Even if Pixi had ramped up though, it might not have mattered, because Sprint, as the #3 player in the US market, wasn’t going to be able to provide market penetration for Pixi like the market was expecting.
We went out and told all our clients that Palm was doomed. Expectations were too high, and even their channel partner didn’t think they could deliver!
Christmas rolled around, and… shockingly… the Pixi disappointed. Then Palm’s stock fell from over $17 in September 2009 to $5.69, the price it was acquired at by HP less than a year later. If HP hadn’t stepped in, Palm probably would have ended up at zero.
Using Uniform Accounting to understand market expectations can revolutionize an investing process. Combining that with research on a company’s supply chain and customer network, and other fundamental research on the company can unlock even more powerful signals.
For instance, right now, one of our favorite stocks is in the RV space. We actually just talked to clients about it earlier this week.
We have such confidence in the company because we aren’t just relying on Uniform Accounting. Yes, it is a compelling idea because the market is pricing in an imminent recession based on Uniform Accounting analytics, but there’s more. When we look at the suppliers and customers in the market, everything they are saying about their outlook for the market tells us the market’s pessimism is wrong, and if anything, fundamentals are getting stronger.
One of the suppliers we’re analyzing is LCI Industries (LCII), who makes parts for the RV market. LCI’s management is showing confidence when they talk about the RV market coming out of an inventory correction, and when talking about the market having recovered as they entered the summer. They’re not the only company management team in the RV marketplace that is signaling fundamentals are strong either.
While that gives us confidence about our Conviction Long Idea, it also gives us reason to highlight LCI itself. The market is also pricing in a lot of pessimism for LCI, that appears unwarranted. LCI has strong fundamentals, and not only are the fundamentals strong, management is showing confidence about fundamental drivers that may enable them to continue to exceed market expectations.
The 2020 Bull-Bear Market Forecast – Event this Friday in Chicago
We regularly get questions from clients in terms of where we are in the macro cycle, especially considering our Market Phase Cycle macro analysis has been spot on so many times over the past six years.
This Friday, there are limited seats available for an update I’m giving in Chicago on our macro outlook.
The 2020 Bull-Bear Market Forecast.
The event is on October 25th, at 9am CST, in downtown Chicago at the Daley building at DePaul’s Driehaus College of Commerce.
There are limited seats available, so please only register if you’re sure of your availability.
To register, and read more, click here.
Market expectations are for significant declines in Uniform ROA, but management is confident about operating margins, acquisitions, and market conditions.
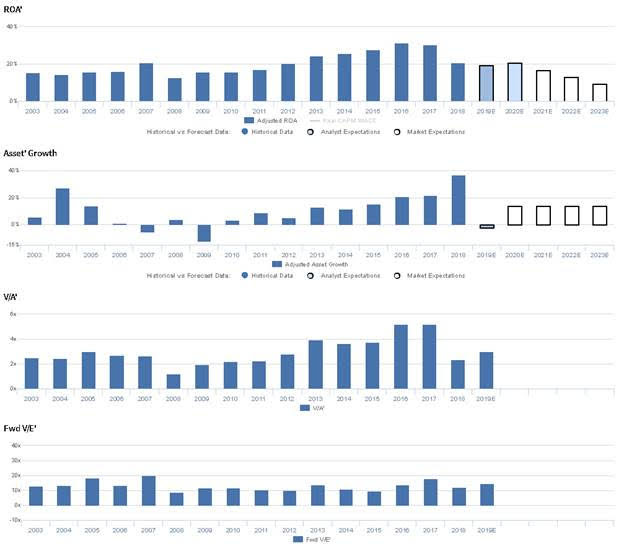
LCII currently trades well below corporate averages relative to UAFRS-based (Uniform) Earnings, with a 15.4x Uniform P/E. At these levels, the market is pricing in expectations for Uniform ROA to decline significantly, from 21% in 2018 to 10% through 2023, accompanied by 14% Uniform Asset growth going forward.
However, analysts have more optimistic expectations, projecting Uniform ROA to remain at current 21% levels through 2020, accompanied by 2% Uniform Asset shrinkage.
After seeing a pullback from 14%-16% levels in 2003-2006 to 13% in 2008 driven by recession-related headwinds, Uniform ROA improved to 30%-31% levels in 2016-2017, as the firm has benefitted from continued age-wave trends that have supported the recreational vehicle market in recent history. However, profitability then fell to 21% levels in 2018 as the firm has focused on growing its asset base. Meanwhile, the firm has seen volatile Uniform Asset growth that has turned positive and robust in recent years, ranging from -12% to 27% in 2003-2012, and 11%-37% since 2013.
Performance Drivers – Sales, Margins, and Turns
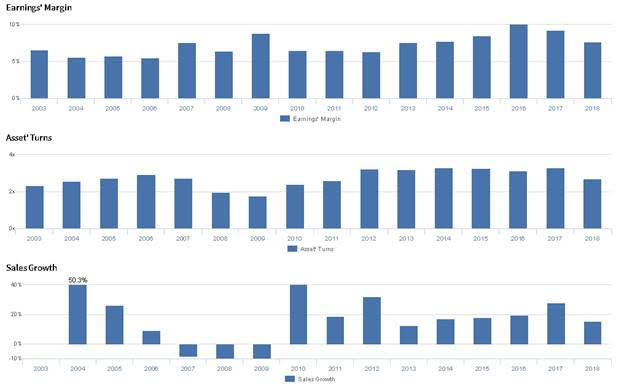
Recent expansion in Uniform ROA has been driven by compounding trends in Uniform Earnings Margin and Uniform Asset Turns. After falling from a high of 2.9x in 2006 to 1.8x in 2009, Uniform Turns have rebounded significantly, rising to 3.2x-3.3x levels from 2012 to 2017, before compressing back to 2.7x in 2018. Meanwhile, Uniform Earnings Margins sustained 6%-7% levels from 2003 to 2012, excluding 8% outperformance in 2007 and 2009, before improving to a peak of 10% in 2016, and declining back to 8% in 2018. At current valuations, markets are pricing in expectations for both Uniform Earnings Margins and Uniform Asset Turns to fall back to historical lows.
Earnings Call Forensics
Valens’ qualitative analysis of the firm’s Q2 2019 earnings call highlights that management is confident the RV industry is in the late stages of inventory correction and that 25% of the RV market will move from manual jacks to electric jacks in 2019. Furthermore, they are confident their recent acquisitions play into their long-term goal to build their European business, and they are confident they have improved operating margin both sequentially and year-over-year. Moreover, they are confident weather-related sales headwinds improved markedly in July.
However, management may be concerned about the value of their Lewmar acquisition and about the impact of tariffs on profitability. Additionally, they may lack confidence in their ability to sustain recent operating efficiency improvements.
UAFRS VS As-Reported
Uniform Accounting metrics also highlight a significantly different fundamental picture for LCII than as-reported metrics reflect. As-reported metrics can lead investors to view a company to be dramatically stronger or weaker than real operating fundamentals highlight. Understanding where these distortions occur can help explain why market expectations for the company may be divergent.
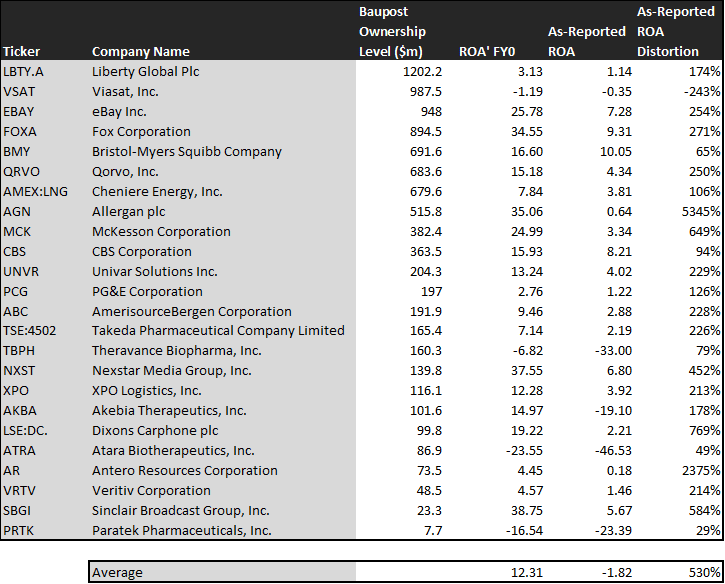
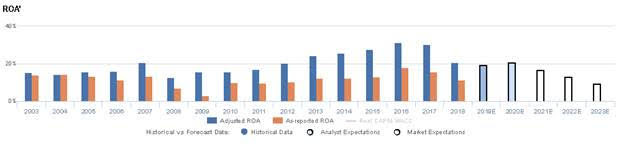
As-reported metrics significantly understate LCII’s profitability. For example, as-reported ROA for LCII was 11% in 2018, materially lower than Uniform ROA of 21%, making LCII appear to be a much weaker business than real economic metrics highlight. Moreover, since 2008, Uniform ROA has been at least 50% greater than as-reported ROA, distorting the market’s perception of the firm’s historical profitability ceiling.
Today’s Tearsheet
Today’s tearsheet is for Mastercard. However, at current valuations, the market is pricing in Uniform EPS growth to be below very robust historic Uniform EPS growth, and below forecast levels. The company has strong profitability, and earnings growth above peer averages, with just peer average valuations.
Regards,
Joel Litman
Chief Investment Strategist


