
The headlines have had it wrong for years—this company is a long-time cash cow and investors already know it

Investors put up with years of losses from this megacap company without a care. The stock kept rising even while the company was running at a significant deficit.
To some investors, this looked like it could have been a copy of the dotcom bubble waiting to happen. However, Uniform Accounting reveals what the market was reacting to in reality.
Also below, Uniform Accounting Embedded Expectations Analysis and the Uniform Accounting Performance and Valuation Tearsheet for the company.
Investor Essentials Daily:
Thursday Tearsheets
Powered by Valens Research
For years, Amazon.com Inc. (AMZN) has dominated news cycles because of its groundbreaking business model, its wealthiest-man-in-the-world founder and CEO, and its ability to seemingly dominate any industry it enters.
With all of these headlines, it can be easy to forget that just a few decades ago it was simply an online bookstore.
Along the way to its current ubiquitous place across the e-commerce and technology world, there were a number of headlines about Amazon’s profits—or lack thereof. Much like every new tech company during the dotcom bubble, Amazon began cash flow negative.
In fact, it was thought to be cash flow negative for almost its first two decades as a company. Back in 2014, Investopedia published an article titled Amazon Never Makes Money But No One Cares.
The article claims that Amazon was not breakeven throughout its history until 2009, and that through its first twenty years as a company, it generated the same amount of profit ExxonMobil (XOM) is able to generate every 2.5 weeks.
Nonetheless, it was one of the best stock investments over that period—far better than ExxonMobil.
Three years later, in May of 2017, Forbes published The Amazon Era: No Profits, No Problem. At the time of publishing, Amazon’s stock was up over 35,000% since its IPO in 1997.
The article argued that investors didn’t care about profits, they were interested in the vision Jeff Bezos was building.
This type of rhetoric was concerning to some who saw it as the same mentality that caused tech sector valuations to swell in the early 2000’s.
That said, by 2018, Amazon was supposedly profitable, and massively so. The company’s combined profits from its first fourteen years of operation was roughly in line with its profits in Q4 2017.
Since the Forbes article was published, Amazon’s stock is up another 75% even after the recent selloff. At this point, it feels as though investors truly don’t seem to care whether or not the company is profitable.
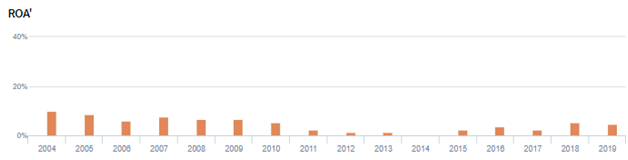
On an as-reported basis, ROA has been consistently muted over the last sixteen years. As recently as 2014 the company had negative earnings, and currently only has a 5% ROA.
That said, just because as-reported metrics say Amazon is unprofitable doesn’t mean it’s true.
When we look at Amazon using Uniform Accounting metrics, investors’ love for Amazon appears more rational.
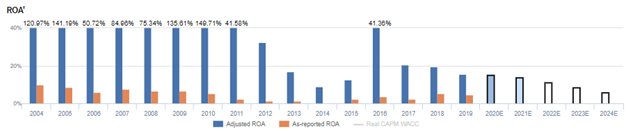
Amazon’s Uniform return on assets (ROA) has been consistently robust since 2004, reaching as high as 150% in 2010 and never dropping below 9%.
These discrepancies are driven by the way as-reported financial statements treat items like non-cash stock option expenses and investments in R&D. Once we adjust these items, it’s clear why Amazon has been one of the best stocks over the last twenty years.
As a result, investors don’t need to be worried about Amazon’s returns but rather, about continued growth.
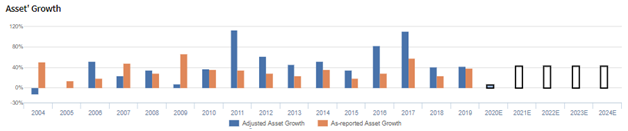
By any measure, Uniform or as-reported, Amazon has been able to grow substantially throughout its history.
As long as Amazon is able to maintain its historical growth rates, market expectations appear reasonable, if not slightly bearish.
Furthermore, despite management’s concerns about items like near-term cost pressures and their one-day shipping offering, they don’t appear to have any concerns about their ability to continue growing.
If this continues to be the case, Amazon should be able to continue surprising the market on the upside.
Amazon.com, Inc. Embedded Expectations Analysis – Market expectations are for Uniform ROA to recover, but management may be concerned about one-day shipping, costs, and counterfeit products
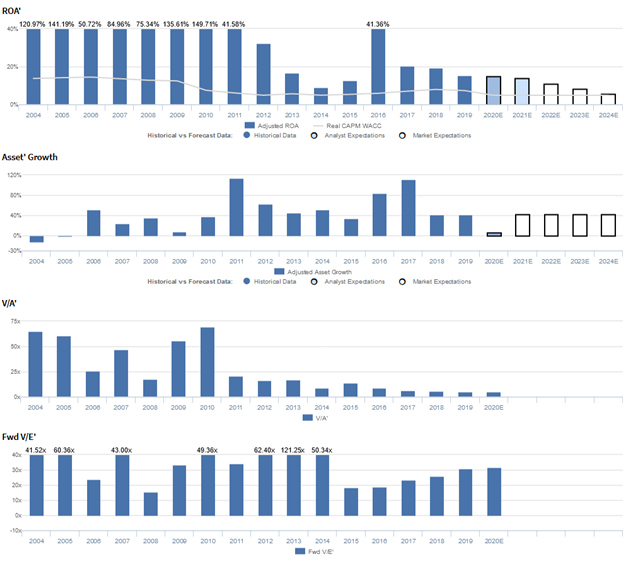
AMZN currently trades above recent averages relative to Uniform earnings, with a 29.9x Uniform P/E (Fwd V/E’).
At these levels, the market is pricing in expectations for Uniform ROA to fall from 16% in 2019 to 6% by 2023, accompanied by 43% Uniform asset growth going forward.
However, analysts have less bearish expectations, projecting Uniform ROA to fade to 14% through 2021, accompanied by 6% Uniform asset growth.
Historically, AMZN has seen volatile, yet generally robust profitability, with Uniform ROA ranging from 9% to 150% since 2004.
While Uniform ROA expanded from 121% in 2004 to 141% in 2005, it subsequently fell to 51% in 2006, before recovering to an all-time high of 150% in 2010.
However, in 2011, as the firm aggressively expanded its asset base through organic growth and a number of acquisitions, including drugstore.com and Quidsi, but failed to materially improve earnings, Uniform ROA fell to 42%.
Thereafter, profitability continued to decline, with Uniform ROA falling to just 9% in 2014, as the firm maintained its aggressive investment efforts, investing ahead of earnings growth.
However, through 2016, AMZN reversed declining profitability trends, and Uniform ROA improved to 42% as the company began to benefit from their investments.
This profitability expansion was not long-lived, as their Whole Foods Market acquisition drove Uniform ROA down to 20% levels through 2018.
Meanwhile, from 2004-2009, AMZN saw volatile Uniform asset growth, ranging from -13% to 52%.
However, since 2010, Uniform asset growth has been consistent and robust, ranging from 34%-113%, as the firm has expanded its geographic footprint while investing heavily in its cloud services businesses.
Performance Drivers – Sales, Margins, and Turns
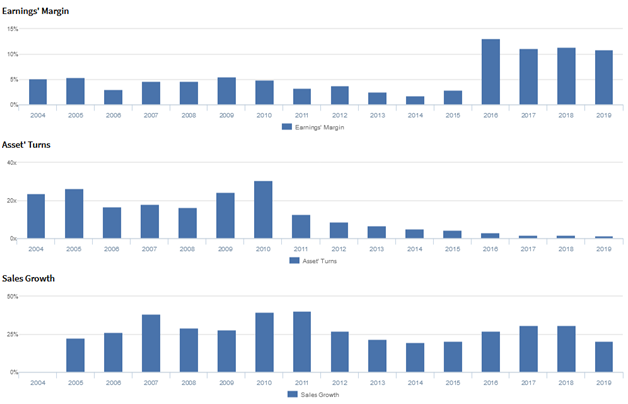
Volatility in profitability has been driven by cyclical Uniform earnings margin and volatility in Uniform asset turns.
From 2004-2005, Uniform earnings margins were stable at 5%, before regressing to 3% in 2006, and expanding to a peak of 6% in 2009. Since then, Uniform earnings margins declined to just 2% in 2014, before recovering to 11% in 2019.
Meanwhile, from 2004-2005, Uniform asset turns improved from 23.6x to 26.3x, before stabilizing at 16x-18x levels through 2008, and rising to a peak of 30.7x in 2010. However, since then, the firm has seen Uniform asset turns compress markedly, to a low of 1.4x in 2019.
At current valuations, markets are pricing in expectations for both Uniform earnings margins and turns to continue declining to historical lows.
UAFRS VS As-Reported
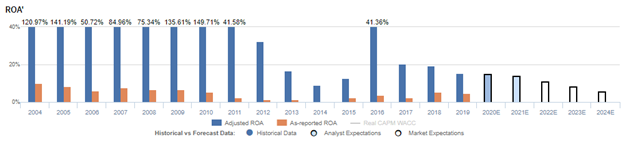
As-reported metrics significantly understate AMZN’s profitability.
For example, as-reported ROA for AMZN was near 5% in 2019, materially lower than Uniform ROA of 16%, making AMZN appear to be a much weaker business than real economic metrics highlight.
Moreover, while Uniform ROA reached 136%-150% levels in 2009-2010, as-reported ROA for AMZN remained at 5%-7% levels, significantly distorting the market’s perception of the firm’s historical profitability.
As such, investors looking at as-reported data may underestimate AMZN’s profitability ceiling.
SUMMARY and Amazon.com Inc. Tearsheet
As the Uniform Accounting tearsheet for Amazon.com Inc. (AMZN) highlights, the Uniform P/E trades at 29.9x, which is above global corporate average valuation levels and its own recent history.
High P/Es require high EPS growth to sustain them. In the case of Amazon, the company has recently shown 15% Uniform EPS growth.
Wall Street analysts provide stock and valuation recommendations that in general provide very poor guidance or insight. However, Wall Street analysts’ near-term earnings forecasts tend to have relevant information.
We take Wall Street forecasts for GAAP earnings and convert them to Uniform earnings forecasts. When we do this, Amazon’s Wall Street analyst-driven forecast is 5% in 2019. That slightly decreases to 3% earnings growth in 2020.
Based on current stock market valuations, we can back into the required earnings growth rate that would justify $1,785 per share. These are often referred to as market embedded expectations. In order to meet the current market valuation levels of Amazon, the company would have to have Uniform earnings grow by 15% each year over the next three years.
What Wall Street analysts expect for Amazon’s earnings growth increases below what the current stock market valuation requires.
Meanwhile, the company’s earnings power is 3x the long-run corporate averages. Furthermore, cash flows are 2x the company’s total obligations, which includes debt maturities, maintenance capex, and dividends, signaling that there is very low cash flow risk to the company’s operations and credit profile.
To conclude, Amazon’s Uniform earnings growth is in line with peer averages. However, the company is trading at above average peer valuations.
Best regards,
Joel Litman & Rob Spivey
Chief Investment Strategist &
Director of Research
at Valens Research


