
The secret to Warren Buffett’s riches

Warren Buffett is a great investor. Many great investors have made themselves billions, but there are few if any investors who have made themselves billionaires through investing. Jim Simons and Ray Dalio, with net worth of $21.6 billion and $18.7 billion are the two investors with the closest wealth to Buffett. Buffett dwarfs them in wealth though, with $80.8 billion.
One of the reasons he’s been so successful is his long-term investment focus, and his consistent value approach. But there is another reason that has been just as beneficial.
Buffett has found a powerful source of capital for his investment. He has owned and reaped the benefits of insurance companies.
Insurance companies offer a unique source of long-term capital. They also are cash flow generating machines thanks to how they’re structured if run correctly.
It is the reason why there was such a fad a few years ago with many hedge funds setting up reinsurance companies, as new sources of long-term capital. This included David Einhorn with Greenlight Re, and Dan Loeb with Third Point Re.
For insurance companies to be revenue-generating machines though, they need to acquire clients in a cost-efficient way, and they need to underwrite efficiently.
So it wouldn’t be surprising that if there was a company focused on helping these cash-generating machines to generate cash and manage their customer acquisition and underwriting lifecycle, this company also would be set up to be a cash flow generating machine.
There’s one company that is focused on just this, ExlService Holdings. Their core businesses are providing solutions for insurance claims management and operations, and around the customer acquisition. And the market has started to realize that servicing cash flow machines has made this company a cash flow machine.

With the stock already having more than doubled in the past few years, investors may think the move has already happened, and the market already figured out what has happened. On the other hand, our Uniform Accounting analysis shows market expectations are still not excessive, and there may be more fundamental room for the stock to run. Not only are the fundamentals strong, management is showing confidence about fundamental drivers that may enable them to continue to exceed market expectations.
The 2020 Bull-Bear Market Forecast – Event this Friday in Chicago
We regularly get questions from clients in terms of where we are in the macro cycle, especially considering our Market Phase Cycle™ macro analysis has been spot on so many times over the past six years.
This Friday, there are a limited seats available for an update I’m giving in Chicago on our macro outlook.
The 2020 Bull-Bear Market Forecast.
The event is on October 25th, at 9am CST, in downtown Chicago at the Daley building at DePaul’s Driehaus College of Commerce.
There are limited seats available, so please only register if you’re sure of your availability.
To register, and read more, click here.
Markets have expectations for Uniform ROA to fall significantly, but management is confident about their acquisitions, EBTIDA, and Analytics business
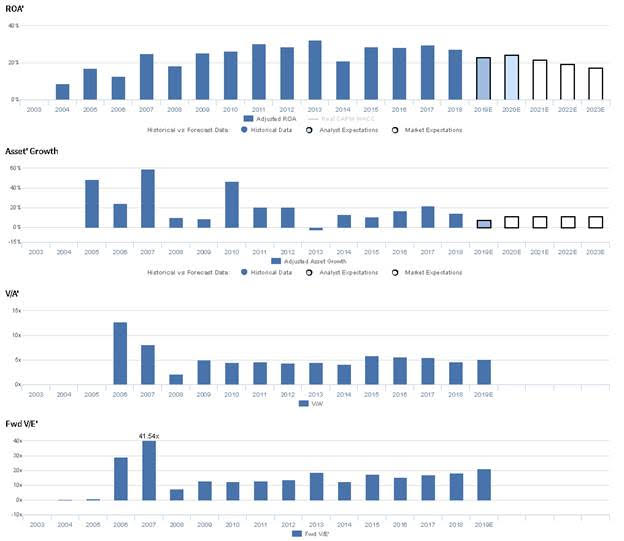
EXLS currently trades near corporate averages relative to UAFRS-based (Uniform) Earnings, with a 21.2x Uniform P/E. At these levels, the market is pricing in expectations for Uniform ROA to decline from 28% in 2018 to 17% by 2023, accompanied by 11% Uniform Asset growth going forward.
Analysts have slightly less bearish expectations, projecting Uniform ROA to decline to 24% levels through 2020, accompanied by 7% Uniform Asset growth.
As an operations management and analytics company, EXLS has historically seen somewhat cyclical, but overall improving profitability. From 2004 to 2013, Uniform ROA improved from 9% to 32%, before falling to 21% in 2014. Thereafter, Uniform ROA improved back to 28%-29% levels from 2015 to 2018. Meanwhile, Uniform Asset Growth has been consistently robust, positive in 13 of the past 14 years, while ranging between -2% and 60%.
Performance Drivers – Sales, Margins, and Turns
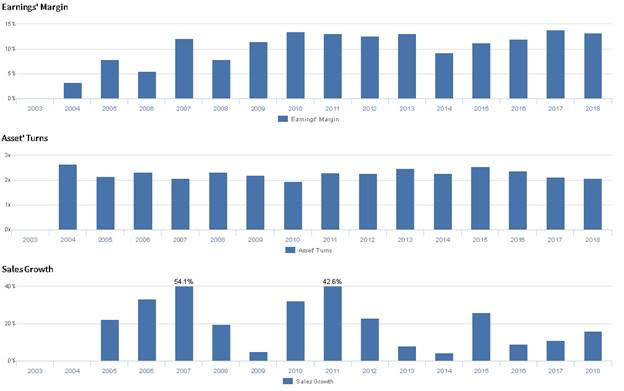
Cyclicality in Uniform ROA has been driven primarily by cyclical Uniform Earnings Margins, supported by strong Uniform Asset Turns. Uniform Earnings Margin improved from 3% in 2004 to a peak of 14% in 2010, before falling to 9% in 2014, and improving to 13%-14% levels in 2017 to 2018. Meanwhile, Uniform Asset Turns fell from 2.7x in 2004 to 2.0x in 2010, before improving to 2.6x in 2015 and sliding back to 2.1x in 2018. At current levels, markets are pricing in expectations for both Uniform Margins and Turns to decline.
Earnings Call Forensics
Valens’ qualitative analysis of the firm’s Q2 2019 highlights that management is confident their SICO acquisition has allowed them to integrate their capabilities to develop technology-based healthcare solutions, and they are confident their Analytics segment grew 6.4% year-over-year. Furthermore, they are confident their EBITDA improved 9% year-over-year and that they are raising their full year revenue guidance based on their first half performance and increased visibility in the remainder of the year. Finally, they are confident their Analytics group gross margin improved in Q2 and that their recently expanded relationship with a Fortune 50 insurer significantly grows their engagements and long-term value generation potential.
However, management may lack confidence in their ability to sustain recent EPS growth, and they may be concerned about the sustainability of organic growth in their Operations Management business. Furthermore, they may be concerned about the impact of their exit from the Health Integrated business, and they may lack confidence in their ability to drive client growth and sustain recent revenue per employee growth.
UAFRS VS As-Reported
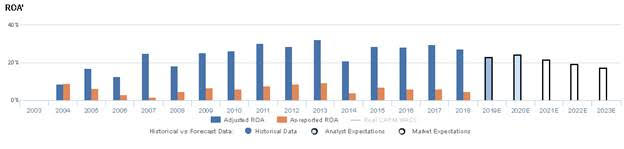
Uniform Accounting metrics also highlight a significantly different fundamental picture for EXLS than as-reported metrics reflect. As-reported metrics can lead investors to view a company to be dramatically stronger or weaker than real operating fundamentals highlight. Understanding where these distortions occur can help explain why market expectations for the company may be divergent.
As-reported metrics significantly understate EXLS’s profitability. For example, as-reported ROA for EXLS was near 5% levels in 2018, materially lower than Uniform ROA of 28%, making EXLS appear to be a much weaker business than real economic metrics highlight. Moreover, as-reported ROA has been less than half Uniform ROA since 2005, distorting investors’ perception of the firm’s historical profitability.
Today’s Tearsheet
Today’s tearsheet is for Procter & Gamble. Procter & Gamble trades at a premium to market average valuations. However, at current valuations, the market is pricing in Uniform EPS growth to be below near-term forecast Uniform EPS growth. The company’s earnings growth is forecast to be above peers, signaling the strength of the company’s fundamentals, even as valuations trade above peers.
Regards,
Joel Litman
Chief Investment Strategist


