
This budget retailer could benefit from the economic pain caused by the coronavirus, just like UAFRS shows it did during the Great Recession

The recovery from the Great Recession was an uneven one, as the wealthy recovered faster than the rest of the population. An example of the struggle most people faced was the high demand for dollar stores, which experienced phenomenal growth during this time.
This budget retail chain is an example that reflects this shift during the recovery period. However, Uniform Metrics paint a different picture of the recovery.
Also below, Uniform Accounting Embedded Expectations Analysis and the Uniform Accounting Performance and Valuation Tearsheet for the company.
Investor Essentials Daily:
Tuesday Tearsheets
Powered by Valens Research
It is generally accepted that the recovery from the Great Recession was an uneven one, as asset price reinflation meant the wealthy recovered faster than the less well-off in the US and globally.
A good example that represents the struggle people faced during this time was the high demand for dollar stores.
Compared to larger retail chains and groceries, these budget store chains offer small units of items for purchase, enabling cash strapped customers to buy what they needed, when they needed it. Oftentimes, it meant they paid more over the long run, but people feel like they have more control over their budget.
Dollar General (DG) is one of the largest of these budget chains. As the country was recovering from the recession, more people were spending more at Dollar General and its competitors. The reality though, is at some point, that wouldn’t have been the case if things were actually improving for those most hard-up for money.
Demand for dollar stores has remained healthy. Today, Dollar General now has over 15,000 stores across 44 states in the US, making them one of the largest retail chains in the country.
Their growth and success can be attributed to their strategy of placing stores in low-income and low-population areas, which allows them to get a significant customer base in areas where larger retail chains are not present.
Store size is also a factor, as this means lower store rent costs which are easier to manage.
Interestingly though, while the anecdotal evidence would imply Dollar General must have done well coming out of the recession, as-reported metrics show that like most companies, the firm took a considerable time to recover.
This is evident in their as-reported Return on Assets (ROA), which only recovered slowly from 4% in 2008, to 10% by 2012, and on to 11% in 2017. Perhaps Dollar General wasn’t as successful in capturing demand from those who were struggling in the recovery as it initially appears.
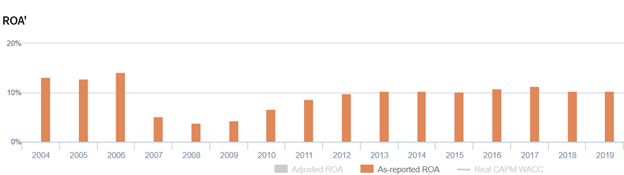
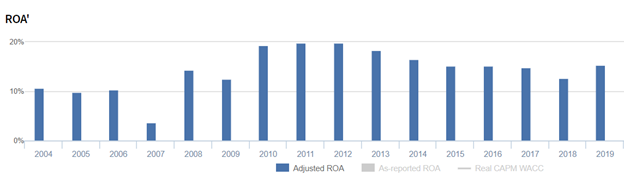
In reality, Dollar General’s Uniform Accounting numbers paint a different picture of the recovery. It paints a picture of a company who strongly benefitted from booming demand for its services, but then saw returns drop as it invested in growth and saw customers “graduate” from needing its services.
As customers were in dire straits coming out of the Great Recession, Dollar General’s Uniform ROA jumped to historic highs, peaking in 2010-2012 at almost 20%. Since then, as the economy recovered and customers were able to shop at alternatives, the company’s returns have actually fallen.
Despite being a one-stop shop for discount items, the economic recovery meant that more people were able to afford better alternatives.
But now, with the economy shutting down due to the coronavirus, demand for Dollar General may surge again like in 2010, which the market doesn’t appear to be pricing in.
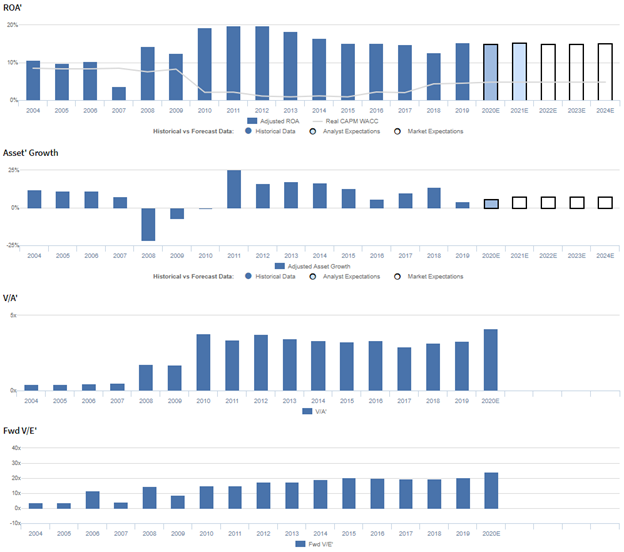
Dollar General Embedded Expectations Analysis – Market expectations are for Uniform ROA to remain stable, and management is confident about their initiatives, inventory, and Fast Track strategy
DG currently trades near historical highs relative to Uniform earnings, with a 24.3x Uniform P/E.
At these levels, the market is pricing in expectations for Uniform ROA to remain at 15% levels through 2024, accompanied by 7% Uniform asset growth going forward.
Analysts have similar expectations, projecting Uniform ROA to sustain 15% levels through 2021, accompanied by 6% Uniform asset growth.
Historically, DG has seen cyclical profitability. Uniform ROA sustained 10%-11% levels in 2004 through 2006, before falling to 4% in 2007.
However, as the economy recovered, Uniform ROA also recovered, expanding to peak 20% levels in 2011-2012, before slowly fading to 15% levels in 2019.
Meanwhile, excluding outlier 22% and 7% shrinkage in 2008-2009 during the height of the Great Recession, Uniform asset growth has been consistent, positive in thirteen out of the past sixteen years, while ranging from -1% to 25%.
Performance Drivers – Sales, Margins, and Turns
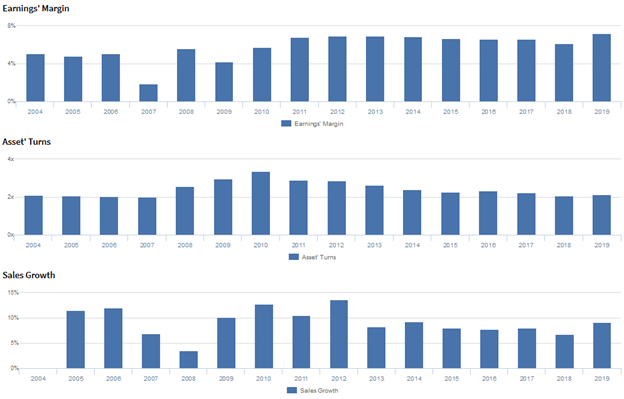
Trends in Uniform ROA have been driven by trends in both Uniform earnings margins and Uniform asset turns.
Uniform margins have been cyclical in nature, falling from 5% in 2004-2006 to 2% in 2007, before improving to 7% levels from 2011 to 2019 excluding 6% underperformance in 2018.
Meanwhile, from 2004 to 2010, Uniform turns steadily improved from 2.1x to 3.4x, before declining back to 2.1x levels in 2019.
At current valuations, markets are pricing in expectations for both Uniform margins and Uniform turns to remain near current levels.
Earnings Call Forensics
Valens’ qualitative analysis of the firm’s Q3 2019 earnings call highlights that management is confident they plan to accelerate the rollout of their non-consumable initiative to 5,000 stores by the end of 2020 and that their private brands are an important area of focus.
In addition, they are confident their inventory gets refreshed multiple times a year and that they are pleased with the adoption of and customer feedback from their Fast Track self-checkout tests.
However, management may lack confidence in their ability to execute operating and strategic priorities and drive long-term top-line growth through their investment strategy.
Moreover, they may be concerned about their expansion of DGX and cooler doors counts, the quality of their Better-For-You offerings, and the sustainability of positive sales and margin performance across their enhanced product categories.
Furthermore, management may be exaggerating the potential of DG Fresh and the sustainability of non-consumable initiative growth.
Finally, they may lack confidence in their ability to increase sales and expand their foreign sourcing penetration, and they may be concerned about their capital allocation priorities.
UAFRS VS As-Reported
Uniform Accounting metrics also highlight a significantly different fundamental picture for DG than as-reported metrics reflect.
As-reported metrics can lead investors to view a company to be dramatically stronger or weaker than real operating fundamentals highlight. Understanding where these distortions occur can help explain why market expectations for the company may be divergent.
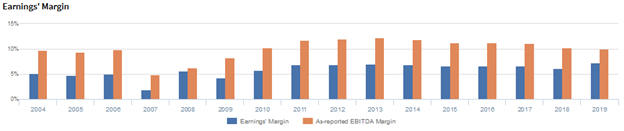
As-reported metrics significantly overstate DG’s margins, one of the primary drivers of profitability.
For example, as-reported EBITDA margin for DG was near 10% in 2019, higher than Uniform Earnings Margin of 7% in the same year, making DG appear to be a much stronger business than real economic metrics highlight.
Moreover, as-reported margins have been consistently greater than Uniform Margins in each year since 2004, significantly distorting the market’s perception of the firm’s performance for well over a decade.
SUMMARY and Dollar General Corporation Tearsheet
As the Uniform Accounting tearsheet for Dollar General (DG) highlights, Uniform P/E trades at 24.3x, which is above corporate average valuations and the company’s historical average valuations for the company.
High P/Es require high EPS growth to sustain them. In the case of Dollar General, the company has recently shown a robust Uniform EPS growth of 33%.
Wall Street analysts provide stock and valuation recommendations that in general provide very poor guidance or insight. However, Wall Street analysts’ near-term earnings forecasts tend to have relevant information.
We take Wall Street forecasts for GAAP earnings and convert them to Uniform earnings forecasts. When we do this, Dollar General Wall Street analyst-driven forecast is for robust Uniform EPS growth of 9% in 2020, and 10% in 2021.
Based on current stock market valuations, we can back into the required earnings growth rate that would justify $173 per share. These are often referred to as market embedded expectations.
In order to meet current market valuation levels, Dollar General would have to have Uniform earnings grow 5% each year over the next three years.
What Wall Street analysts expect for Dollar General’s earnings growth is higher than what the current stock market valuation requires.
Meanwhile, the company’s earnings power is 3x corporate averages, and their robust cash flows and cash on hand signal that there is low risk to the company’s operations and credit profile.
To conclude, Dollar General’s Uniform earnings growth is above peer averages, but the company’s price to earnings is roughly in line with peer average valuations.
Best regards,
Joel Litman & Rob Spivey
Chief Investment Strategist &
Director of Research
at Valens Research


