
This company has used unorthodox ways to try to keep up with its peer, and Uniform Accounting metrics show it’s working, and might be accelerating

Despite never eclipsing its largest rival, this company has been able to enter new markets by leveraging a strong portfolio of brands.
While as-reported ROA looks fairly pedestrian for the name, TRUE UAFRS-based (Uniform) analysis shows that, as a result of its strategy, this company has been able to produce steady and robust profitability.
In addition, despite lofty valuations, management continues to be confident about their strategy for the company going forward, suggesting market expectations may not be as unreasonable as they initially appear.
Also below, Uniform Accounting Embedded Expectations Analysis and the Uniform Accounting Performance and Valuation Tearsheet for the company
Investor Essentials Daily:
Thursday Tearsheet & Embedded Expectations
Powered by Valens Research
Some of the most profitable companies in the world gain success through unconventional means, by entering into brand new markets in order to spur demand for existing products.
For example, recently, through the launch of Disney+, The Walt Disney Company (DIS) entered the streaming world, a completely new industry for the firm that has been historically dominated by Netflix (NFLX). Its goal: to find a new way to monetize its content engine.
By leveraging their existing intellectual property and film portfolio, Disney has been able to attract millions of new viewers to its service in just a few months. This move has unlocked a potentially massive growth driver for the company.
Apple (AAPL) entered the the credit card market with the AppleCard in the hopes of further integrating its entire ecosystem with customers lives, leading to more sales of the company’s hardware and services.
Rolls Royce has focused on providing servicing of the company’s airplane engines in the last several years, but not because it wants to move into the services industry. It knows that by maintaining the engines, it will generate more demand for those engines over time and sell more parts.
The strategy of entering a new market to support existing offerings is not particularly new to the business world, even if it is not common.
For decades, PepsiCo (PEP) lagged behind Coca-Cola (KO) as the #2 soft-drink company in the world. Coca-Cola’s strategy of rapid expansion and focus on accessibility was incredibly successful in the marketplace.
Coca-Cola was everywhere; from vending machines, to grocery stores, to hotel room bars. Most notably, the firm had established a strong foothold in restaurants. Pepsi could not penetrate the space.
Since the company could not poach large Coca-Cola clients through direct negotiation, it had to find another method.
Unafraid of unconventional mergers, as exemplified by its combination with Frito-Lay in 1965 to form PepsiCo, Pepsi came up with an unorthodox way to encroach on Coca-Cola’s restaurant dominance. It would just own restaurants. That way, Coca-Cola couldn’t keep it out of those restaurants.
Through the acquisitions of Pizza Hut in 1977, Taco Bell in 1978, and later, KFC in 1986, Pepsi was able to amass a sizeable portfolio of popular fast food franchises.
The firm quickly transitioned these fast-food giants from Coca-Cola to Pepsi, finally establishing its place in the marketplace and allowing it to strengthen its soft drink brands.
Although entering restaurants was first a valuable stepping stone, over time Pepsi’s fast food division began to drag on operations. Restaurants had different requirements than potato chips and soda. Capital expenditures were high, and although the firm tried to transition to a franchise model, fast food was barely a cost-of-capital business.
In 1997, Pepsi decided it didn’t make sense to keep the two businesses together. It spun-off its fast food division as Tricon Global Restaurants, later renamed Yum! Brands (YUM).
Even though it no longer owns Yum! Brands, Pepsi has still been able to leverage its past relationship to continue to be the soft drink supplier of choice for these iconic fast food chains, benefitting its core business. Taco Bell even uses its Frito-Lays products, like Doritos, in its offerings.
Although Pepsi has still not been able to surpass Coca-Cola, through this and other strategies, it made sure that it will not be shut-out again from new markets, and has been able to benefit from being a strong #2 as a result.
Using as-reported metrics, investors may be misled to believe that Pepsi’s strategy has faltered in recent years, as return on assets (ROA) have declined from peak 13%-14% levels in 2003-2008 to a trough of 8%-9% in 2011-2018.

However, Uniform Accounting indicates that as-reported metrics are understating Pepsi’s profitability and shows how the strength of its brands has enabled Pepsi to have robust and remarkably stable returns, with a Uniform ROA of 21%-24% in each year since 2007.
But investors appear to recognize that as-reported metrics are artificially distorting the company’s performance. At the current stock price, the market expects Pepsi to see Uniform ROA rise from 24% in 2018 to an all-time high of 31%.
Although these expectations are lofty, management is confident about global demand, brand growth, and their portfolio strategy, signaling that market optimism may be warranted.
PepsiCo Embedded Expectations Analysis – Markets have bullish expectations for PEP, and management is confident about global demand, growth, and their strategy
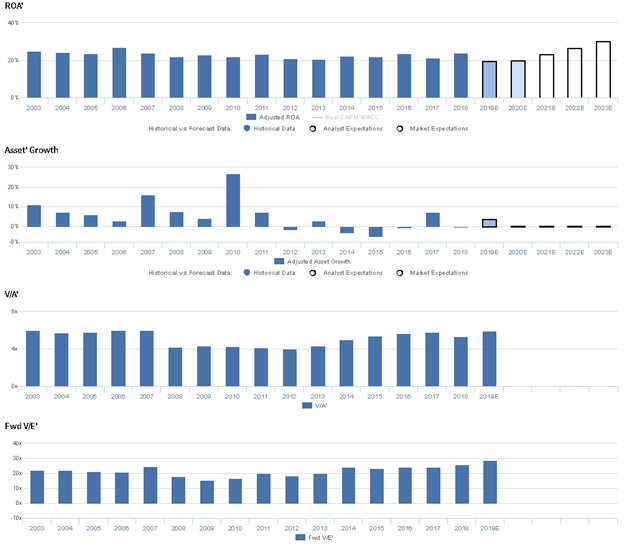
PEP currently trades at historical highs relative to UAFRS-based (Uniform) Earnings, with a 29.1x Uniform P/E. At these levels, the market is pricing in expectations for Uniform ROA to expand from 24% in 2018 to a record-high of 31% in 2023, accompanied by immaterial Uniform Asset growth going forward.
However, analysts have bearish expectations, projecting Uniform ROA to decline to 20% in 2020, accompanied by 4% Uniform Asset growth.
Historically, PEP has seen relatively stable, robust profitability. After ranging from 24%-27% from 2003-2007, Uniform ROA faded to 21%-24% levels through 2018.
Meanwhile, from 2003-2011, Uniform Asset growth was robust, ranging from 3%-27%, with the latter driven by their consolidation of PepsiAmericas and The Pepsi Bottling Group in 2010.
Since then, Uniform Asset growth has been volatile, positive in just two of the past seven years, while ranging from -5% to 7%.
Performance Drivers – Sales, Margins, and Turns
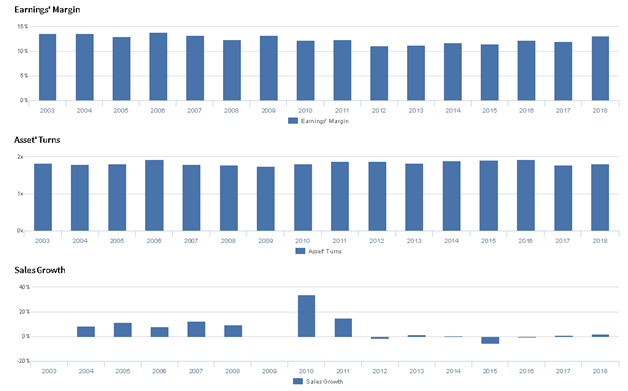
Stability in Uniform ROA has been driven by trends in both Uniform Earnings Margin and Uniform Asset Turns.
Specifically, Uniform Margins faded from 13%-14% levels from 2003-2007 to 11% in 2012-2013, before recovering to 13% in 2018.
Meanwhile, Uniform Turns have remained stable at 1.7x-1.9x levels since 2003.
At current valuations, markets are pricing in expectations for record expansion in both Uniform Margins and Turns.
Earnings Call Forensics
Valens’ qualitative analysis of the firm’s Q3 2019 earnings call highlights that management is confident they saw growth in each of their key retail channels and that Quaker Foods saw net revenue growth in North America.
Management is also confident their demand has remained strong globally, and they are confident in their ability to launch transformational programs for SodaStream.
Moreover, management is confident their goal is to keep their brands relevant and attractive to modern consumers.
However, management may lack confidence in their ability to improve water use efficiency, and they may be exaggerating the strategic opportunities they see for SodaStream.
Furthermore, they may be exaggerating the health benefits their Zero Bolt24 product provides to athletes, and they may be concerned about their ability to capture future demand.
UAFRS VS As-Reported
Uniform Accounting metrics also highlight a significantly different fundamental picture for PEP than as-reported metrics reflect. As-reported metrics can lead investors to view a company to be dramatically stronger or weaker than real operating fundamentals highlight. Understanding where these distortions occur can help explain why market expectations for the company may be divergent.
As-reported metrics significantly understate PEP’s profitability. For example, as-reported ROA for PEP was 8% in 2018, materially lower than Uniform ROA of 24%, making PEP appear to be a much weaker business than real economic metrics highlight.
Moreover, since 2010, as-reported ROA has been less than half of Uniform ROA in each year, significantly distorting the market’s perception of the firm’s profitability ceiling.
SUMMARY and PepsiCo Tearsheet
As our Uniform Accounting tearsheet for PepsiCo (PEP) highlights, Pepsi trades at a 29.1x Uniform P/E, which is well above corporate averages and historical levels for the company.
High P/E levels require high EPS growth to sustain valuations. Recently, Pepsi has only been able to grow its Uniform EPS by 9%.
While Wall Street stock recommendations and valuations poorly track reality, Wall Street analysts have a strong grasp on near-term financial forecasts like revenue and earnings.
As such, we use Wall Street GAAP earnings estimates as a starting point for our Uniform earnings forecasts. When we do this, we can see that Pepsi is forecast to see Uniform EPS shrinkage of 15% in 2019 followed by 10% growth in 2020.
Based on current stock market valuations, we can use earnings growth valuation metrics to back into the required growth rate to justify Pepsi’s $138 stock price. These are often referred to as market embedded expectations. In order to justify current stock prices, the company would need to have Uniform earnings grow by a modest 4% each year over the next three years.
Wall Street analyst earnings growth expectations are volatile over the next two years, but ultimately, they may fall short of the earnings growth rates required to justify current valuations.
With high valuations, Pepsi’s Uniform P/E is above peer averages, while its Uniform EPS growth falls short of peer averages.
Meanwhile, the company’s earning power is 4x corporate averages, and although cash flows and cash on hand falling below total obligations suggests high dividend risk, its operating sustainability and refinancing capability suggests low credit risk.
To summarize, Pepsi is a company with high earning power, with equally high embedded expectations, and it must sustain its historical earnings growth to justify current valuations.
Best regards,
Joel Litman & Rob Spivey
Chief Investment Strategist &
Director of Research
at Valens Research