
This timetable investment offers the ability to own world-beating firms without hassle, Uniform Accounting highlights why it’s so dominant

For some investors looking to retire, they do not have the time or the capital required to create a tailor-made portfolio of stock ideas.
For these investors, they should follow a timetable strategy, where they allocate their funds based on the time until they will need to access them. When looking at the longest time horizon, many investors turn to this ETF to diversify their risk.
In addition to examining the portfolio, we’re including a deeper look into the fund’s largest current holding, providing you with the current Uniform Accounting Performance and Valuation Tearsheet for that company.
Investor Essentials Daily:
Friday Uniform Portfolio Analytics
Powered by Valens Research
“It is better to be roughly right than precisely wrong”
– John Maynard Keynes
The regular reader of Valens Research knows that the vast majority of our content is built around investment opportunities in individual stocks. It is through analyzing specific securities where the power of Uniform Accounting can provide the most value, and spot the rare market mispricing. However, this strategy is not always applicable to individual investors looking for a retirement strategy.
Many individual investors do not have a large enough pool of capital to invest in a portfolio of individual stocks. Furthermore, they may lack the time and resources to choose which stocks to invest in, as well as manage a dynamic portfolio. For this type of investor, the primary concern should not be selecting individual stocks, but ensuring their “timetable” is correct.
A timetable investor is not concerned over which securities to add to their portfolio. Rather, they are thinking about when they need to access their savings, and allocating their funds accordingly.
Different asset classes see varying returns, and will experience varying short term volatility. By dividing up savings into buckets based on when the investor is likely to need access to their funds, they will not leave any money on the table.
That is what we mean by a person’s timetable. Understanding when you, as an investor, need access to your capital can help determine which type of asset class you should deploy your savings into.
All of the funds that need to be accessed in the next two years should be kept in money market or treasury funds, to minimize the potential volatility. Then, any money that needs to be spent in the next two to five years should be allocated in bond funds, which provides a better return with slightly more volatility. In the five to ten year bucket, a split of bonds and stocks generates a greater average return as the tolerance for volatility increases. Finally, for any capital that isn’t needed in the next ten years, it should be invested in the stock market.
While short term volatility makes the stock market a poor investment for a short time horizon, historically, stocks have rarely lost out to any other asset class in any period greater than ten years.
For investors following the timetable to retirement, the less compex the equity vehicle, the better. The ideal equity investment would be a highly diversified fund with low fees, where investors can steadily invest through dollar-cost averaging.
This is why we recommend an exchange traded fund (ETF) which tracks the S&P 500. By putting your retirement money with the 500 largest, most profitable companies in the United States, you will have exposure to technology, healthcare, consumer discretionary, financials…and even real estate among other industries.
Investors do not even need to worry about a domestic vs. international exposure when investing the S&P 500. This is because the index already generates approximately 40% of its revenue internationally.
There are a multitude of different ETFs an investor can choose to gain exposure to the S&P 500. One of the most popular choices, though not always the correct choice, is the SPDR S&P 500 ETF, or the SPY.
Every week, we analyze actively managed fund’s holdings under a UAFRS framework to determine their investing strength. This week, we are looking at the top 15 holdings of the SPY to see how those companies look from a quality and valuation perspective.
As so many timetable investors rely on a S&P 500 ETF in their retirement portfolio, it is important to see the strength of the largest firms. After all, the biggest 15 companies in the S&P 500 make up over 32% of the entire index.
One third of what an owner of the S&P 500 owns…is just these 15 companies.
Using as-reported metrics, it may appear a S&P 500 ETF is a poor choice for a timetable investor to unlock value in the long term. However, these securities are in truth stronger names once Uniform Accounting metrics are reviewed.
See for yourself below.

Using as-reported accounting, investors would think buying into the SPY ETF would lead to losing out on investment potential.
On an as-reported basis, many of these companies are poor performers with returns at 9% or below, with the average as-reported return on assets (ROA) right around 11%.
In reality, the average company in the index displays an impressive average Uniform ROA at 32%.
Once we make Uniform Accounting (UAFRS) adjustments to accurately calculate earning power, we can see the underlying strength inherent in investing into an S&P 500 ETF.
Once the distortions from as-reported accounting are removed, we can see that Visa (V) does not have an average return of 14%, but a sizable ROA of 65%.
Similarly, Disney’s (DIS) ROA is really 16%, not at 5%. While as-reported metrics are portraying the company as a business below cost-of-capital, Uniform Accounting shows the company’s true robust operations.
UnitedHealth Group (UNH) is another great example of as-reported metrics mis-representing the company’s profitability. UnitedHealth Group doesn’t have an 8% ROA, it is actually at 36%.
The list goes on from there, for names ranging from Microsoft (MSFT) and Apple (AAPL), to Facebook (FB), Mastercard (MA), and Nvidia (NVDA).
If investors were looking at only as-reported metrics, they would assume passive investing means accepting exposure to firms with substandard returns. In reality, the largest firms in the world have the returns to match.
Now, let us see how these firm’s returns can compound over time through EPS growth.
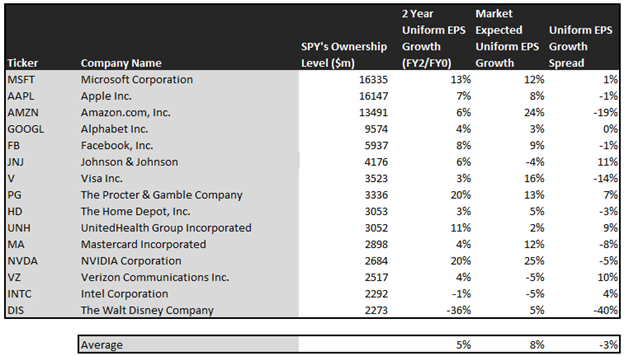
This chart shows three interesting data points:
- The 2-year Uniform EPS growth represents what Uniform earnings growth is forecast to be over the next two years. The EPS number used is the value of when we take consensus Wall Street estimates and we convert them to the Uniform Accounting framework.
- The market expected Uniform EPS growth is what the market thinks Uniform earnings growth is going to be for the next two years. Here, we show by how much the company needs to grow Uniform earnings in the next 2 years to justify the current stock price of the company. If you’ve been reading our daily analyses and reports for a while, you’ll be familiar with the term embedded expectations. This is the market’s embedded expectations for Uniform earnings growth.
- The Uniform EPS growth spread is the spread between how much the company’s Uniform earnings could grow if the Uniform earnings estimates are right, and what the market expects Uniform earnings growth to be.
The average company in the US is forecast to have 5% annual Uniform Accounting earnings growth over the next 2 years. As these large firms make up a significant portion of the market, it is no surprise the SPY’s top holdings are forecast by analysts to also grow at 5%.
On average, the market is pricing these companies to grow earnings by 8% a year. While this is not significantly larger than analyst expectations, this is sizable as these companies are already so large. It highlights that by buying the largest companies, you often are buying companies where the market already has high expectations.
However, that doesn’t mean there aren’t still interesting growth opportunities within the SPY.
One example of a company in the SPY with higher growth than the market expects is Verizon Wireless (VZ). While the market expects Verizon Wireless to shrink by 5% over the next two years, analysts forecast the firm to see a 4% growth over the same period.
Another company with similar dislocations is Proctor and Gamble (PG). The company is forecast for Uniform EPS to grow by 20% a year, and the market is expecting the company to only grow by 13%.
Yet another example is Johnson & Johnson (JNJ). The company is cheap, as it is priced for a 4% contraction in Uniform earnings, but the company is forecast to in fact grow their EPS by 6% in the next two years.
That being said, there are some companies that are forecast to have strong earnings growth, but the market is paying a higher premium. For these companies, like Disney (DIS), Amazon (AMZN), and Visa (V), the market has growth expectations in excess of analysts’ predictions.
In conclusion, investors are often turned off to passive investing, even if they lack the time or capital required to effectively manage a portfolio. However, if they stick to a timetable strategy, it makes sense to invest in a passive ETF such as the SPY. The largest companies in the U.S. are impressive operators worthy of being owned, once we peel away the as-reported distortions.
SUMMARY and Microsoft Corporation Tearsheet
As the SPY’s largest individual stock holding, we’re highlighting Microsoft Corporation’s tearsheet today.
As our Uniform Accounting tearsheet for Microsoft Corporation (MSFT:USA) highlights, Microsoft’s Uniform P/E trades at 29.6x, which is above average valuation levels and its historical average levels.
High P/Es require high EPS growth to sustain them. In the case of Microsoft, the company has recently shown a 22% Uniform EPS growth.
Wall Street analysts provide stock and valuation recommendations that in general provide very poor guidance or insight. However, Wall Street analysts’ near-term earnings forecasts tend to have relevant information.
We take Wall Street forecasts for GAAP earnings and convert them to Uniform earnings forecasts. When we do this, Microsoft’s Wall Street analyst-driven forecast is a 21% and a 6% Uniform EPS growth in 2020 and 2021, respectively.
Based on current stock market valuations, we can use earnings growth valuation metrics to back into the required growth rate to justify Microsoft’s $203 stock price. These are often referred to as market embedded expectations.
To justify current valuations, the company would need to grow their Uniform EPS by 12% each year over the next three years. What Wall Street analysts expect for Microsoft’s earnings growth is above what the current stock market valuation requires in 2020, but below the requirement in 2021.
Furthermore, the company’s earning power is 6x the corporate average. Also, cash flows are 4x higher than its total obligations—including debt maturities, capex maintenance, and dividends. Together, this signals low credit and dividend risk.
To conclude, Microsoft’s Uniform earnings growth is above peer averages in 2020. However, the company is trading below average peer valuations.
Best regards,
Joel Litman & Rob Spivey
Chief Investment Strategist &
Director of Research
at Valens Research