
2020 is looking to be the shortest recession in history

The National Bureau of Economic Research (“NBER”) has released its report breaking down the conditions of the coronavirus induced recession.
After such a shock to the world economy, supply chains and government budgets are still looking to settle. However, many today are now asking about the risk of this shock inducing another recession in the near future.
Today, we will look at the credit picture of the U.S. economy to understand the risk of an upcoming longer-term recession.
Investor Essentials Daily:
The Monday Macro Report
Powered by Valens Research
The private nonprofit organization National Bureau of Economic Research (“NBER”), officially defines a recession as a “significant decline in economic activity spreading across the economy, lasting more than a few months.”
When the NBER’s Business Cycle Dating Committee drafted this definition in 2009, it could never have foreseen the economic “black swan” event that brought the world to a standstill in 2020.
As you probably remember, during the first week of February 2020, the economy was roaring along. The unemployment rate was low, the credit picture looked good, and companies were posting record earnings.
Then, toward the end of the month, the coronavirus pandemic sent everything to a grinding halt. According to the NBER, by the end of April 2020, the recession was over. By June 2020, the U.S. GDP was already back to its pre-pandemic peak, and the stock market was blasting into space.
As we think about where the economy is headed, we need to understand where it’s coming from and the structural factors that allowed it to weather the storm quickly.
As we talk about in the Market Phase Cycle, which you can subscribe to here, market cycles are driven by debt.
Recessions typically occur as the economy becomes more unstable, thanks to corporations taking on more debt. A one-time shock creates a credit crunch, making it difficult for firms to refinance, leading to market panic. In turn, that same lack of credit often draws out the recovery as businesses are strapped for cash and cannot grow.
This is why when people were running for the hills in March 2020 and April 2020, we were telling investors to hold tight, as these symptoms of a drawn out credit crash didn’t match the usual pattern.
The reality is that corporate and personal balance sheets didn’t just look fine, but they looked great. The U.S. debt universe was much healthier than it typically would be at the start of a recession. Even the companies in the worst shape received loads of federal cash to allow them to refinance their debt.
Without a wave of defaults crashing the financial system (as it did during the Great Recession), the economy last year got its footing quickly after hitting March lows. All it needed was a quick realignment of priorities and an understanding of how to function under social-distancing rules, which took about two months.
The outcome would have been much different had a structural problem existed with our collective finances. But let’s take a look at the macro-debt picture as it stood at the onset of the pandemic.
Using our Credit Cash Flow Prime (“CCFP”) analysis tool, which leverages the full power of Uniform Accounting to diagnose the credit health of any company, or the entire market, we can see that not only did companies have enough cash to pay back their debts, but their annual Uniform gross cash earnings were sufficient to cover everything except buybacks.
Let’s use our aggregate CCFP tool to gauge the quality of debt taken on by the S&P 1500 Composite Index, which encompasses 90% of the market capitalization of U.S. stocks.
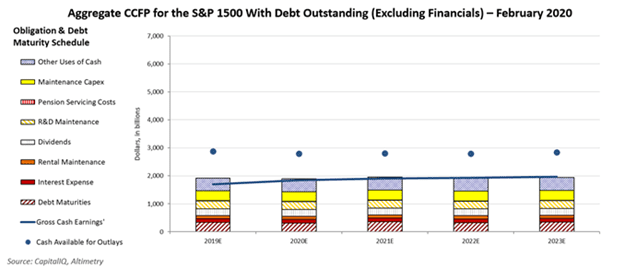
Corporate America’s debt buffer was instrumental in getting us to where we are now, coming off an impressively healthy economic recovery. While cash flows have barely matched obligations, from 2019 through to 2023 cash on hand across the economy means the risk of widespread defaults is low.
The learning curve for distanced productivity, and even the start-and-stop pandemic issues, are of little consequence for the stock market recovery, as equity prices are valued in the long term.
Now, let’s turn to the present. Has the recovery shackled the economy in looming clouds of credit bound to put corporate America in an awkward spot, or is the debt picture still healthy?
As you can see, debt looks better than ever.
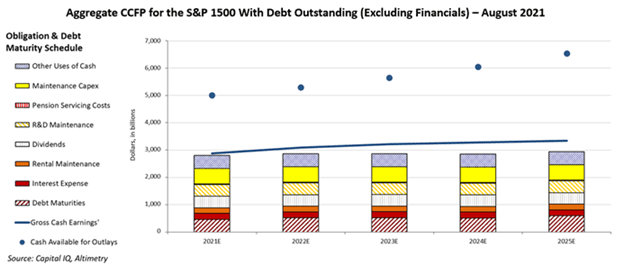
Although total corporate obligations among companies with debt outstanding have increased from about $1.9 trillion to about $2.8 trillion, the buffer between cash on hand and obligations has doubled from about $1 trillion to $2 trillion.
Uniform gross earnings are expected to cover not only operating obligations and debts but also buybacks. The corporate debt stack seems nearly bulletproof as it stands. This means we’re still well-positioned for this staggeringly strong recovery to sustain going forward.
Best regards,
Joel Litman & Rob Spivey
Chief Investment Strategist &
Director of Research
at Valens Research


