
2021 was the year of the IPO… How will 2022 stack up?

With a slew of companies going public in 2021, Renaissance’s IPO ETF became the year’s must-have ETF.
Firms went public at rates not seen since before the dot-com boom over twenty years ago, and profits associated with going public skyrocketed as well. This means public investors wanted a piece of the IPO profits as well.
To better understand why Renaissance’s IPO ETF has become so popular among retail investors, let’s use Uniform Accounting to perform a portfolio audit of its largest holdings and answer a simple question – are recently IPOd firms priced for outsized growth?
Also below, a detailed Uniform Accounting tearsheet of the fund’s largest holding.
Investor Essentials Daily:
Friday Uniform Portfolio Analytics
Powered by Valens Research
When Renaissance Capital launched its IPO ETF in 2013, investors doubted the introduction of the product to the market. For the past few decades, companies had been going private at a pace far quicker than companies had gone public.
Two years ago, at the start of 2020, the coronavirus acted as a catalyst that has moved the market down a different path. Markets and individuals in the United States could never have imagined a scenario in which the entire economy would shut down virtually overnight.
From consumers who would typically run to the gym in the morning finding themselves seeking virtual alternatives, to working professionals seeking ways to conduct business without traveling to conferences in different cities, traditional ways of doing business and providing services needed an overhaul on the fly.
With the government providing liquidity to the economy at historically cheap rates, investors are using “blank check” special purpose acquisition companies (SPACs) to take companies public. This meant rapidly rising tech and biotech companies hoping to capitalize on their burgeoning demand found the process of going public much easier.
After years of investor and industry figureheads clamoring about the slew of companies leaving the public markets, the narrative finally shifted. As the economy came to a halt, IPO activity continued to ramp up.
Prior reasons for going private included being acquired by larger competitors and by private equity firms were halted as traditional transactions slowed considerably in 2020 amidst fears of the future.
Even increased public company disclosures, with requirements such as Sarbanes Oxley, and headaches such as activist shareholders and proxy battles were beginning to be dealt with.
Blockbuster IPOs in recent years have led firms to go public at increasingly aggressive valuations.
However, a pull-out from the U.S. market by Chinese startups amid increased tensions between the two nations has started to dry up both the Chinese IPO pipeline and the amount of capital inflows from China to the United States.
As the IPO market continues to burgeon and investors realize that some of the firms brought public via SPAC were perhaps brought along too early, investors may begin to become wary of approaching bubble territory.
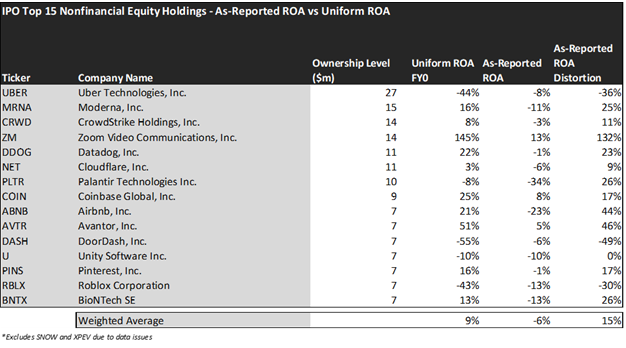
Given the IPO market’s bullishness thus far, let’s examine Renaissance Capital’s top fifteen IPO holdings under the Uniform Accounting lens. This will help us understand what the market may be missing about the ETF’s biggest bets, and what sort of growth is already priced into its valuations.
The cornerstone of the Renaissance Capital IPO ETF strategy is to invest in companies that are listed on a U.S stock exchange after recently completing an IPO.
With investments in high-growth technology companies like Uber (UBER), Zoom (ZM), and Palantir (PLTR), the strategy hopes to provide investors with a way to get in on these companies early.
To some, the strategy appears to be a bubble waiting to burst, as these companies are valued at sky-high valuations and are not profitable. The bet though is that these companies are on the way to reaching their profitability potential.
The truth, however, is that many of these “unprofitable” and “overvalued” companies generate better returns than as-reported metrics imply. Economic productivity, which is just a measure of a company’s use of resources, is massively misunderstood on Wall Street. This is reflected by the 130+ distortions in the Generally Accepted Accounting Principles (GAAP) that make as-reported results poor representations of real economic productivity.
These distortions include the poor capitalization of R&D, the use of goodwill and intangibles to inflate a company’s asset base, a poor understanding of one-off expense line items, and flawed acquisition accounting.
It is no surprise that once many of these distortions are accounted for, many of the companies that the IPO ETF tracks are actually robustly profitable, but most investors wouldn’t realize it.
The average as-reported ROA among IPO’s top ten names is a concerning -6%, which implies to investors that these companies are in fact destroying economic value for their investors. In reality, these companies perform far better, with a 9% Uniform ROA.
Datadog (DDOG), for example, doesn’t return -1% ROA per year. It actually boasts a 22% Uniform ROA, in line with what a software-enabled tech company can reasonably be expected to do.
Similarly, Airbnb (ABNB) does not have -23% returns. As an e-commerce platform with a tiny asset base, it also has a 21% Uniform ROA.
These dislocations demonstrate that recently public firms are in a better financial position than GAAP may make their books appear. But there is another crucial step in the search for alpha. Investors need to also find companies that are performing better than their valuations imply.
Valens has built a systematic process called Embedded Expectations Analysis to help investors get a sense of the future performance already baked into a company’s current stock price. Take a look:

This chart shows four interesting data points:
- The Uniform ROA FY0 represents the company’s current return on assets, which is a crucial benchmark for contextualizing expectations.
- The Analyst-Expected Uniform ROA represents what ROA is forecast to be over the next two years. To get the ROA number, we take consensus Wall Street estimates and we convert them to the Uniform Accounting framework.
- The market-implied Uniform ROA is what the market thinks Uniform ROA is going to be in the three years following the analyst expectations, which for most companies here is 2023, 2024, and 2025. Here, we show the sort of economic productivity a company needs to achieve to justify its current stock price.
- The Uniform P/E is our measure of how expensive a company is relative to its Uniform earnings. For reference, average Uniform P/E across the investing universe is roughly 24x.
Embedded Expectations Analysis of IPO paints a clear picture of the ETF. The stocks it tracks are expensive.
While analysts expected average ROA to increase from 9% to 32%, the market is pricing these companies to grow their economic profitability to 65%.
A company like Zoom, which provides video conferencing services, could see returns like the 86% expected by the market or even the 105% expected by analysts. However, it is a challenge to imagine other more asset-intensive companies being able to achieve the Uniforms ROAs expected of it.
The market expectations for a firm like DoorDash (DASH), which operates on razor thin margins and faces steep market competition, to achieve 130% ROA compared to analyst expectations of -9% appear to be completely unreasonable.
Bullish expectations on companies like DoorDash create situations where investors may find themselves disappointed.
This just goes to show the importance of valuation in the investing process. Finding high growth and quality firms is only half of the process. The other, just as important part, is attaching reasonable valuations to the companies.
To see a list of companies that have great performance and innovation also at attractive valuations, the Valens Conviction Long List is the place to look. The conviction list is powered by the Valens database, which offers access to full Uniform Accounting metrics for thousands of companies.
Click here to get access.
Read on to see a detailed tearsheet of the largest holding in IPO.
SUMMARY and Uber Technologies, Inc. Tearsheet
As Renaissance Capital Greenwich Funds – Renaissance IPO ETF’s largest individual stock holdings, we’re highlighting Uber Technologies, Inc.’s tearsheet today.
As our Uniform Accounting tearsheet for Uber Technologies, Inc. (UBER:USA) highlights, its Uniform P/E trades at 149.9x, which is way above the global corporate average of 24.0x and its historical average of 61.3x.
High P/Es require high EPS growth to sustain them. In the case of Uber, the company has recently shown a 50% Uniform EPS shrinkage.
Wall Street analysts provide stock and valuation recommendations that, in general, provide very poor guidance or insight. However, Wall Street analysts’ near-term earnings forecasts tend to have relevant information.
We take Wall Street forecasts for GAAP earnings and convert them to Uniform earnings forecasts. When we do this, Uber’s Wall Street analyst-driven forecast is for EPS to shrink by 75% in 2021 and 138% in 2022.
Meanwhile, the company’s earning power is below the long-run corporate averages. However, cash flows and cash on hand are nearly 2x total obligations—including debt maturities, capex maintenance, and dividends. This signals a low credit risk.
Lastly, Uber’s Uniform earnings growth is below peer averages, but the company is trading above its average peer valuations.
Best regards,
Joel Litman & Rob Spivey
Chief Investment Strategist &
Director of Research
at Valens Research