
A Failed Playwright Trained the Greatest Value Investor Ever – What’s Really in His Portfolio Now?

One of the greatest investors of all time attributes most of his investing success to learning under a failed playwright.
That failed playwright went on to become known as the author of two of the greatest books on value investing ever and one of the greatest teachers of investing as well.
We’ll look at how his greatest student is applying those teachings in his portfolio today. This would be an incredibly difficult task without Uniform Accounting (UAFRS).
In addition to examining the portfolio, we’re including a deeper look into his largest current holding, providing you with the current Uniform Accounting Performance and Valuation Tearsheet for that company.
Investor Essentials Daily:
Friday Uniform Portfolio Analytics
Powered by Valens Research
In the world of value investing, Ben Graham is the father, and maybe now also the grandfather, of successful value investing. Between Security Analysis in 1934 and Intelligent Investor published in 1949, he laid down the core framework that many of the greatest value investors have used and still build on today.
However, in 1934, while Ben Graham was writing Security Analysis, he was also attempting to get his own Broadway musical produced.
Graham had written Baby Pompadour, a play about a journalist whose writing is influenced by his singer mistress.
It had a semi-successful off-Broadway run, and Graham had gotten Irving Steinman, a producer, to back the production’s Broadway launch.
Steinman just had one condition, his fiancé, who was apparently not a very talented singer or actress, had to be the lead.
The play opened at the Vanderbilt Theater that stood for more than 35 years on West 48th Street. It ran for just one week.
It was a disaster. Critics panned the musical.
One stated:
“Graham had better…find himself a new hobby”
Another wrote:
“The only humor in his [Graham’s] comedy comes during those pathetic moments when the unfortunate actors – who are here spared the humiliation of identification – find themselves with nothing more to do than laugh at their own pitiful jokes”
The musical closed as a failure in short order, and Graham gave up on being a playwright, and instead turned his focus fully towards financial writing, investing, and teaching security analysis.
But while this failure may have been a big let-down for Graham, investors should be forever grateful that he was not successful as a playwright. Instead of dedicating his life to the arts, he dedicated his time to understanding investment research and teaching it to those who would listen.
Ben Graham’s greatest student was, of course, Warren Buffett. Buffett actually received an A+ in Graham’s investing class.
Warren Buffet summarized Graham’s teachings with this one comment:
“The basic ideas of investing are to look at stocks as businesses, use the market’s fluctuations to your advantage, and seek a margin of safety. That’s what Ben Graham taught us. A hundred years from now they will still be the cornerstones of investing.”
We also should be grateful that Graham didn’t have much success in the theater because if he had, Buffett might never have become the greatest practitioner of value investing.
Buffett studied under Graham shortly after Graham wrote Intelligent Investor. He earned his Master’s degree in Economics from Columbia in 1951. Studying under Ben Graham was a major draw for him in attending Columbia.
After leaving Columbia, Buffett took several stops through the world of finance, including working for Ben Graham’s investment partnership. Then, Buffett gained control of Berkshire Hathaway.
Once he attained control, he started investing the holding company’s money applying Graham’s principles – and produced phenomenal returns.
Over 50 years, Buffett’s Berkshire Hathaway produced an annualized 21.7% return, compared to a 9.8% return for the S&P 500. That’s roughly 12% a year in annualized alpha.
A $1,000 investment in the S&P500 in 1965 would have been worth $97,000 by 2014. That same $1,000 invested in Berkshire Hathaway would have been worth over $15 million by 2014.
How does Buffett find companies where the market has mis-priced the business, offering a significant margin of safety and value investing opportunity?
One thing for sure, he is not relying on the as-reported GAAP earnings numbers to conduct his analysis.
Buffett has said quite bluntly time and time again:
“The net earnings figure… it really is not representative of what’s going on in the business at all…”
“The GAAP rules… I’ve warned you about the distortions.”
“The ‘bottom line’ figures are totally capricious. It’s really a shame”
“You should concentrate on the world of companies, not arcane accounting mathematics.”
Buffett has regularly railed against issues with as-reported accounting metrics. He’s mocked the changes with net income causing Berkshire’s earnings to swing quarter to quarter in ways that completely misrepresent the company’s performance.
Buffet is not alone in recognizing that as-reported earnings numbers and other financial statement data is terribly problematic and misleading. He is certainly one of the more outspoken on the issue.
If the earnings number is not reliable, then neither is the as-reported earnings growth number. That makes the P/E, price to earnings ratio, just as useless.
Graham mentions the importance of a company’s “earning power” over a hundred times in his books. Unfortunately, as-reported earnings is a poor metric for examining a firm’s earning power.
So, any examination of Buffett’s portfolio, or your portfolio, using as-reported data would be a complete waste of time. It might be worse than that. Using as-reported financial data could cause you to make some very bad decisions… buying businesses that you shouldn’t, and selling businesses that you ought to have held.
That’s why Uniform Accounting and Uniform Financial Analytics are so powerful. Financial data that reflects the real economic performance and valuation of firms is necessary for great value investing. It unlocks and reveals insights about the world of companies that arcane accounting – the existing accounting – hides and misleads.
Berkshire’s internal analysis unsurprisingly lines up directly with analysis using cleaned-up, consistent financial metrics calculated with Uniform Accounting.
We’ve conducted a portfolio audit of Berkshire’s top holdings, based on their most recent 13-F, this time focusing on their non-financial company holdings.
We’re showing a summarized and abbreviated analysis of how we work with institutional investors to analyze their portfolios.
On one hand, the goal is to uncover any potential ‘torpedos,’ which are terrible stocks that are being hidden under as-reported financial metrics.
We also look for companies that may actually be far better performers than the as-reported metrics might imply. These are names the investor may want to “lean in” on.
Using as-reported accounting, investors would be scratching their heads at some of the companies that Berkshire is buying.
One fantastic measure of Graham’s all-important company earning power is Return on Assets. Calculated correctly, it would display how well a company deploys its investments into assets to generate cash flows.
In this portfolio analysis, we show that earning power metric calculated with both as-reported financial data, that Buffett would strongly warn against doing.
We then calculate earning power using Uniform Accounting based metrics. This is done by restating the financial statements of all companies to a single, consistent set of global accounting standards, UAFRS (Uniform Adjusted Financial Reporting Standards).
UAFRS puts all companies on an even playing field of consistently applied rules, removing the accounting distortions that Buffett and so many great investors warn against.
We applied this framework to Buffett’s current portfolio.
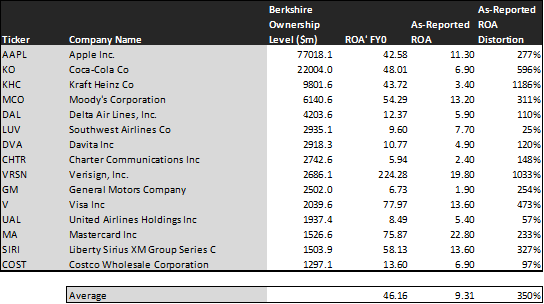
The average company in the portfolio displays an average return on assets (ROA) at 9%. On an as-reported basis, many of these companies are poor performers with returns below 5%-6%.
On an as-reported financial metric basis, it would appear that Buffett has taken leave of his senses, building a stock portfolio of average to low earning power businesses.
If we look at the median, the median company in their portfolio only is producing a miserly 7% ROA. The current US corporate average firm has a return of 12%.
However, once we make Uniform Accounting (UAFRS) adjustments to accurately calculate earning power, we can see that the returns of the companies in Buffett’s portfolio are much more robust.
In fact, Buffett really does buy high quality companies. GAAP accounting would not see that. Uniform Accounting makes his investment philosophy come alive.
“It’s far better to buy a wonderful company at a fair price than a fair company at a wonderful price.”
Buffett doesn’t just buy companies at discounts to intrinsic value. He wants to buy companies with strong economic moats, where he can trust their returns to sustain for the foreseeable future.
The real average Uniform ROA for a company in Buffett’s portfolio is 46%. That’s almost 4x the average company in the US currently. Buffett is living by his mantra and buying high quality companies.
Once the distortions from as-reported accounting are removed, we can realize that Apple doesn’t have an 11% ROA, it is actually at 43%.
Coca-Cola’s ROA is really 48%, not 7%.
Kraft Heinz doesn’t have a 3% ROA, it is actually at 44%.
The list goes on from there, for names ranging from Davita and Delta to Visa, Mastercard, and Costco.
If Berkshire was looking at as-reported metrics, they would never pick most of these companies, because they look like bad companies, and poor investments.
Berkshire isn’t just finding companies where as-reported metrics mis-represent a company’s real profitability.
The reason Buffett has such phenomenal returns is because he’s also identifying companies where the market is significantly undervaluing the company’s potential. This is where Graham’s teachings about finding companies with a margin of safety, trading below intrinsic value comes into play.
Berkshire is buying companies that the market has low expectations for, low expectations the companies can exceed.

This chart shows three interesting data points:
– The first datapoint is what uniform earnings growth is forecast to be over the next two years, when we take consensus Wall Street estimates, and we convert them to the Uniform Accounting framework. This represents the uniform earnings growth the company is likely to have, the next two years
– The second datapoint is what the market thinks uniform earnings growth is going to be for the next two years. Here we are showing how much the company needs to grow uniform earnings by in the next 2 years, to justify the current stock price of the company. If you’ve been reading our daily and our reports for a while, you’ll be familiar with the term embedded expectations. This is the market’s embedded expectations for uniform earnings growth
– The final datapoint is the spread between how much the company’s uniform earnings could grow if the Uniform Accounting adjusted earnings estimates are right, and what the market expects uniform earnings growth to be
The average company in the US is forecast to have 5% annual Uniform Accounting earnings growth over the next 2 years. Berkshire’s holdings are forecast by analysts to outpace that, growing at 11% a year the next 2 years, on average. Berkshire is not just finding value companies, because of their focus on strong companies and brands, they’re able to find intrinsically undervalued companies that still have growth characteristics.
On average, the market is pricing these companies to only grow earnings by 5% a year. While these companies are growing robustly, they are intrinsically undervalued, as the market is mispricing their growth by 6%-7% on average.
These are the kinds of companies that a value-investing great would be interested in. Without Uniform numbers, the GAAP numbers would leave everyone confused.
One example of a company in the Berkshire portfolio that has growth potential that the market is mispricing is Delta (DAL). Delta’s analyst forecasts have 11% Uniform earnings growth built in, but the market is pricing the company to have earnings shrink by 6% earnings each year for the next two years.
Another company with similar dislocations is Visa (V), with market expectations for a 7% growth in earnings, with the company actually forecast for Uniform EPS to grow by 14% a year. Yet another is the fund’s largest holding, Kraft Heinz (KHC), which is priced for a 9% decline in uniform earnings, when they are forecast to grow by earnings by 3% a year.
On the other hand, there are some companies in the portfolio that Berkshire may need to take another deeper review of.
On the other hand, there are some companies in the portfolio that Berkshire may need to take another deeper review of.
The two that jump out are Charter Communication (CHTR) and Costco (COST).
For Charter, the market is pricing the company for 6% annual earnings shrinkage, when the analysts forecast a reduction of 11% of earnings annually.
Similarly, the market is pricing Costco to have 11% earnings growth going forward, when even the analysts are only forecasting 5% earnings growth.
This doesn’t look like an intrinsically undervalued company, if anything the market looks significantly too bullish.
But for the most part, Berkshire’s portfolio looks like a high quality, undervalued set of stocks with businesses displaying strong earning power.
Clearly, Buffett’s portfolio reflects what Buffett says. They don’t rely on GAAP reported earnings numbers.
Berkshire gets it right because they’re not trusting the as-reported accounting statements. Their focus on understanding growth better than anyone else is likely to continue to power strong returns. This Uniform Accounting portfolio review shows it.
Apple Tearsheet
As Berkshire’s largest holding now, at $77 billion, we’re highlighting Apple’s tearsheet today.
As our Uniform Accounting tearsheet for Apple highlights, Apple trades below market average valuations. The company has recently had 2% Uniform EPS growth. EPS growth is forecast to grow by 3% in 2020, and 5% in 2021. At current valuations, the market is pricing the company to see earnings grow by just 1% a year going forward.
The company’s earnings growth is forecast to be slightly above peer averages for next year, but the company also trades at a slight premium to peer average valuations. The company has robust returns, and no cash flow risk to their dividend. Check out the tearsheet to see a lot more
Best regards,
Joel Litman & Rob Spivey
Chief Investment Strategist &
Director of Research
at Valens Research