
Uniform Accounting shows how a “fast follower” mentality has been worth a trillion dollars to this company, but it might be coming to an end

As one of the world’s largest companies, this firm hasn’t become successful by being a premier innovator, as some would think, but by being a premier fast follower.
While as-reported ROA looks middling for the name, TRUE UAFRS-based (Uniform) analysis shows that the firm has been able to consistently produce both robust Uniform ROA and Uniform asset growth by pursuing a fast-follower strategy.
However, returns have started to falter as its flagship products age. In addition, management appears to be concerned about their outlook, which may mean returns will continue to decline.
Also below, Uniform Accounting Embedded Expectations Analysis and the Uniform Accounting Performance and Valuation Tearsheet for the company.
Investor Essentials Daily:
Tuesday Tearsheets
Powered by Valens Research
When talking about innovation in business, Apple (AAPL) often comes to mind.
From the first Mac to the iPod to the iPhone, the firm has launched inventions that have revolutionized the world and how it interacts with technology.
However, more often than not, the firm hasn’t been first-to-market with new ideas. It hasn’t been the innovator. Instead, it’s been a fast follower—and sometimes not so fast follower.
Apple’s founder, Steve Jobs was renowned for his abilities as a tinkerer. He would take ideas from colleagues, partners, or even competitors, and look for ways to optimize them.
Instead of looking to rush ideas to the market, he and the firm made sure the product would meet rigorous quality standards. Customer experience was imperative.
As such, many ideas that didn’t meet the mark, such as their widely hyped AirPower charging mat that never made it to stores.
This constantly-fiddling approach has led to a lot of, possibly inferiority complex induced, teasing from Android users. Android users would mock iPhone owners and Apple loyalists for being excited about a new offering that Samsung or Google or another firm had had for years.
Features such as an HD screen, wireless charging, and portrait mode had been around in Android products for months, or even years, before Apple adopted it in its flagship product.
Although it hasn’t been the first, this strategy of optimizing existing technology to create the best, most unified user experience has made Apple into one of the world’s most successful and well-known companies.
It’s why it is one of a handful of companies to ever eclipse a $1 trillion market cap.
But when looking at as-reported metrics, investors wouldn’t be blamed for scratching their heads as to why Apple is one of the world’s most valuable companies.
With a middling 11%-12% as-reported ROA (orange bars) in each year since 2016, Apple doesn’t look like a world-class operator with an unrivaled user experience. In fact, it looks more like a company that really is just a fast follower.
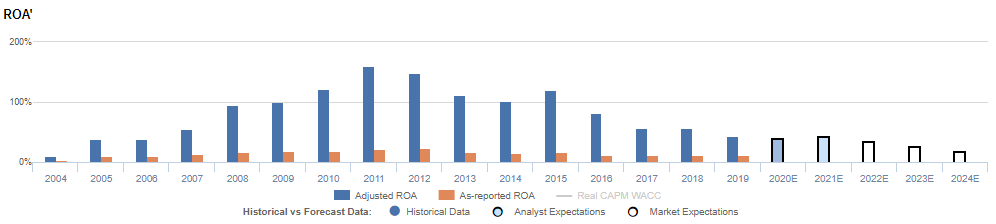
However, when looking at Uniform ROAs (blue bars), we can see just how successful this firm has been. Over the past four years, Uniform ROA has remained above 42% in each year, and historically, has surpassed 150%, as a result of the iPhone’s widespread success.
In addition, the firm has been able to maintain these massively high returns despite robust Uniform asset growth, which hasn’t dipped below 16% in any year for over a decade.

Apple’s success can be attributed largely to its incredibly intelligent R&D investment and holistic view, allowing it to command premium pricing from clients, and establish a brand that people trust and continue to keep coming back to.
However, Apple has also been so successful, in many respects, that it has largely saturated the market with its core hardware products and has had to turn its focus to new growth areas.
As a result, the market expects this necessity to move away from its core competencies to be a hindrance for the firm and is pricing in expectations for Uniform ROA to continue to decline to less robust levels.
Additionally, management appears less confident about its outlook for these new growth opportunities. Specifically, management may be concerned about their ability to maintain growth across their main segments and geographies, improve their sales in China, and to continue to innovate new product offerings.
As such, current market expectations may seem warranted, and the firm will have to tailor its fast follower strategy to new markets in order to sustain its historical success.
Apple Inc. Embedded Expectations Analysis – Market expectations are for material declines in Uniform ROA, and management appears concerned about growth, China, and innovation
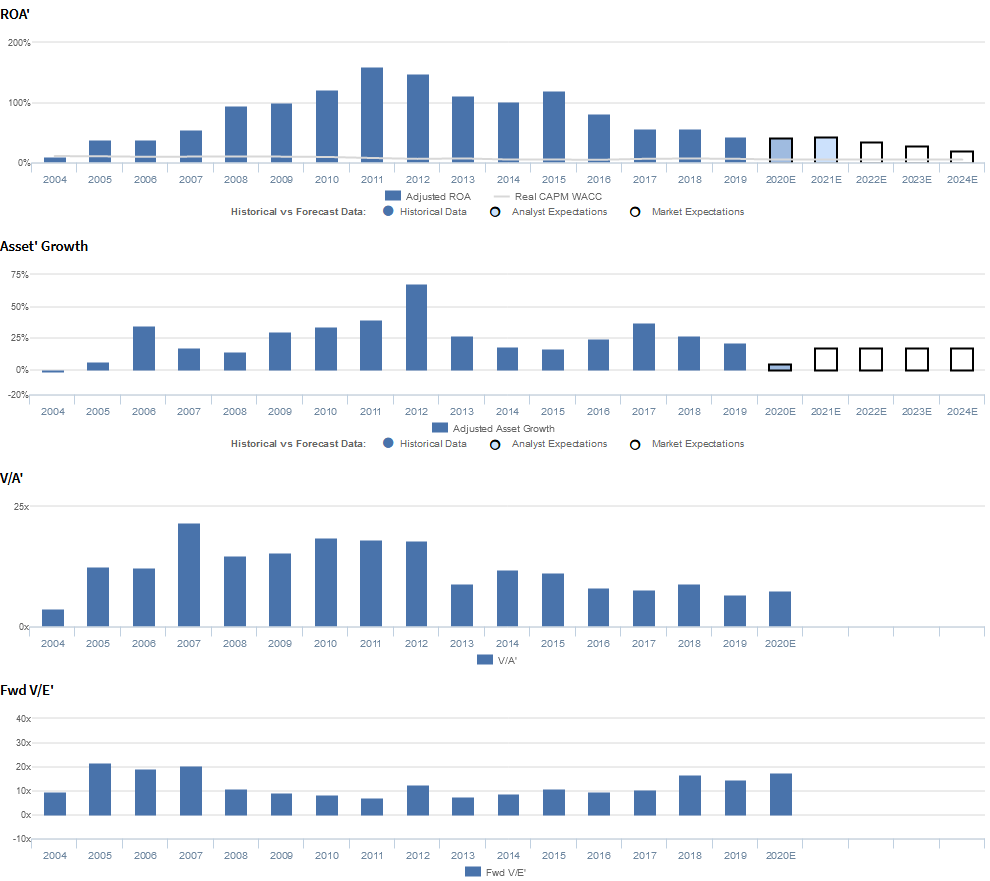
AAPL currently trades near corporate averages relative to Uniform earnings, with a 16.7x Uniform P/E (Fwd V/E′).
At these levels, the market is pricing in expectations for Uniform ROA to continue to decline from 43% in 2019 to 18% in 2024, accompanied by 17% Uniform asset growth going forward.
Analysts have less bearish expectations, projecting Uniform ROA to decline slightly to 42% by 2021, accompanied by 4% Uniform asset growth.
AAPL has historically seen robust profitability, with Uniform ROA rising from 10% in 2004 to a peak of 159% in 2011, driven initially by strong demand for their iPod products, and then by the launch and continued success of the iPhone.
However, since then, Uniform ROA has steadily declined, to 43% in 2019, as iPhone sales have slowed and the firm has struggled to develop new successful products to drive growth.
Meanwhile, since 2006, Uniform asset growth has been robust and consistent, positive in each year, while ranging from 14%-68%.
Performance Drivers – Sales, Margins, and Turns
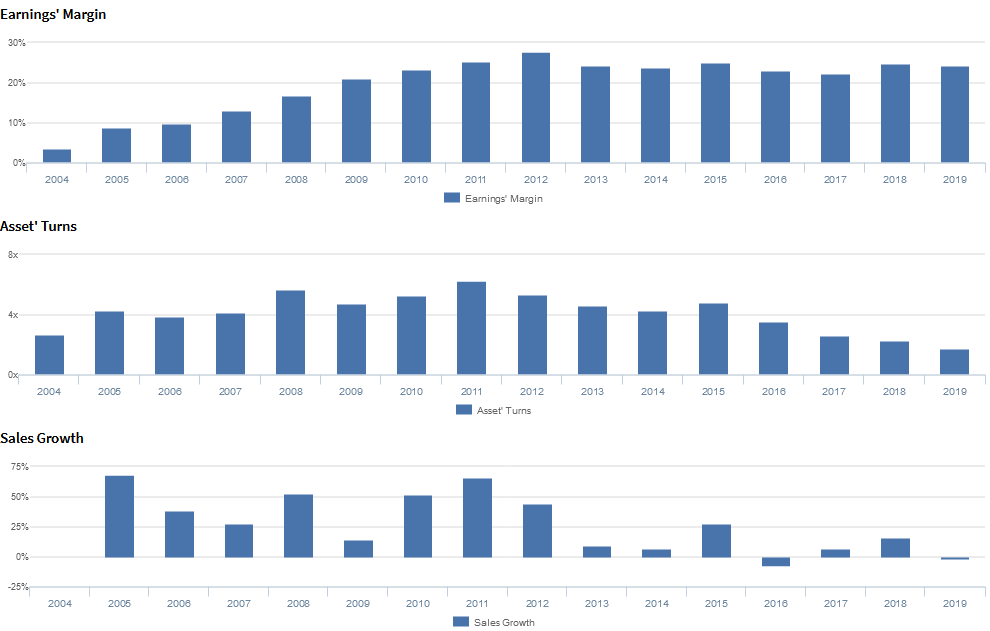
Strength in Uniform ROA has been driven by trends in both Uniform earnings margin and Uniform asset turns.
From 2004-2012, Uniform earnings margins expanded from 4% to 28%, before fading to 22%-25% levels since then.
Meanwhile, Uniform asset turns improved from 2.7x in 2004 to a peak of 6.3x in 2011, before declining to 1.8x in 2019. This suggests that recent declines in profitability have been driven by the firm’s inability to deploy assets with the same efficiency as it had historically.
At current valuations, markets are pricing in expectations for Uniform asset turns to remain near pre-iPhone levels, accompanied by a deterioration in Uniform earnings margins.
Earnings Call Forensics
Valens’ qualitative analysis of the firm’s Q1 2020 earnings call highlights that management is confident that increases in handset upgrades is due in part to partners making sure customers stick with them through the changing 5G environment and about deferring revenue for their offer of a free year of Apple TV+ services.
However, they are also confident Mac and iPad had a difficult year-over-year comp due to the launches of MacBook Air, Mac mini, and iPad Pro.
Moreover, management may lack confidence in their ability to sustain double-digit growth across their main product categories and geographies, maintain Services gross margin, and manage content development costs.
In addition, they may be concerned about the impact of the coronavirus on sales in China and the pace of 5G deployment.
Furthermore, management may be exaggerating their ability to innovate, the quality of their Night mode photos and Apple TV+ content, and the sustainability of iPhone trade-ins.
UAFRS VS As-Reported

Uniform Accounting metrics also highlight a significantly different fundamental picture for AAPL than as-reported metrics reflect.
As-reported metrics can lead investors to view a company to be dramatically stronger or weaker than real operating fundamentals highlight. Understanding where these distortions occur can help explain why market expectations for the company may be divergent.
As-reported metrics significantly understate AAPL’s profitability.
For example, as-reported ROA for AAPL was at 11% levels in 2019, materially lower than Uniform ROA of 43%, making AAPL appear to be a much weaker business than real economic metrics highlight.
Moreover, while Uniform ROA has decreased from 82% in 2016 to 43% in 2019, as-reported ROA has remained at 11%-12% levels in this time frame, significantly distorting the market’s perception of the firm’s recent profitability trends.
SUMMARY and Apple Inc. Tearsheet
As the Uniform Accounting tearsheet for Apple Inc. (AAPL) highlights, it trades at a 16.7x Uniform P/E, which is below global corporate average valuation levels, but above its own historical averages.
Below average P/Es require below average EPS growth to sustain them. In the case of Apple, the company has recently shown a 2% Uniform EPS growth.
Wall Street analysts provide stock and valuation recommendations that in general provide very poor guidance or insight. However, Wall Street analysts’ near-term earnings forecasts tend to have relevant information.
We take Wall Street forecasts for GAAP earnings and convert them to Uniform earnings forecasts. When we do this, we can see that Apple is forecast to see no growth in Uniform EPS in 2020 and a rebound to 14% in 2021.
Based on current stock market valuations, we can back into the required earnings growth rate that would justify $241 per share. These are often referred to as market embedded expectations. In order to meet the current market valuation levels of Apple, the company would have to have Uniform earnings shrink by 2% each year over the next three years.
What Wall Street analysts expect for Apple’s earnings growth far exceeds what the current stock market valuation requires.
Meanwhile, the company’s earnings power is 7x corporate averages, signaling that there is very low cash flow risk to the company’s operations and credit profile.
To conclude, the market expects modest earnings growth for Apple, which it has been and is projected to be able to achieve. In addition, it’s robust earnings power signals low risk for its operations in the near-term.
Best regards,
Joel Litman & Rob Spivey
Chief Investment Strategist &
Director of Research
at Valens Research


