
This company is going through the “Adobe” – and they’re only halfway through their journey

In April 2012, Adobe took a step into the unknown. Many investors lambasted them for their strategy shift, saying they were insane.
Adobe was abandoning their cash cow software business, where they were able to get customers to pay $1.3k-$2.6k or more for their software, with regular upgrade cycles meaning repeat payments of that price every 18 months or so. They announced they were betting that a shift to a subscription model at significantly lower monthly price points would actually lead to more users and more revenue.
Only in 2013, revenue dropped from $4.4 billion to $4.05 billion. In 2014 revenue barely rose, hitting $4.15 billion, still not approaching 2012 highs. It looked like Adobe had made a serious misstep. Making up their lost software product revenue with subscription revenue was proving harder than they expected. Uniform returns had also almost fallen in half, from around 30% levels in 2012 to around 15% in 2014.
But something happened in 2014 under the hood. In 2014 the company’s subscription revenue exceeded their product sales revenue for the first time. By 2015, the companies combined revenue had really started to pick up, rising from $4.15 billion to $4.8 billion, exceeding 2012 levels. Uniform ROA rose to 24%. It is at 60% now, double what it was in 2012.
The market had rewarded Adobe’s gamble, with the stock up over 900% since they announced their plan.
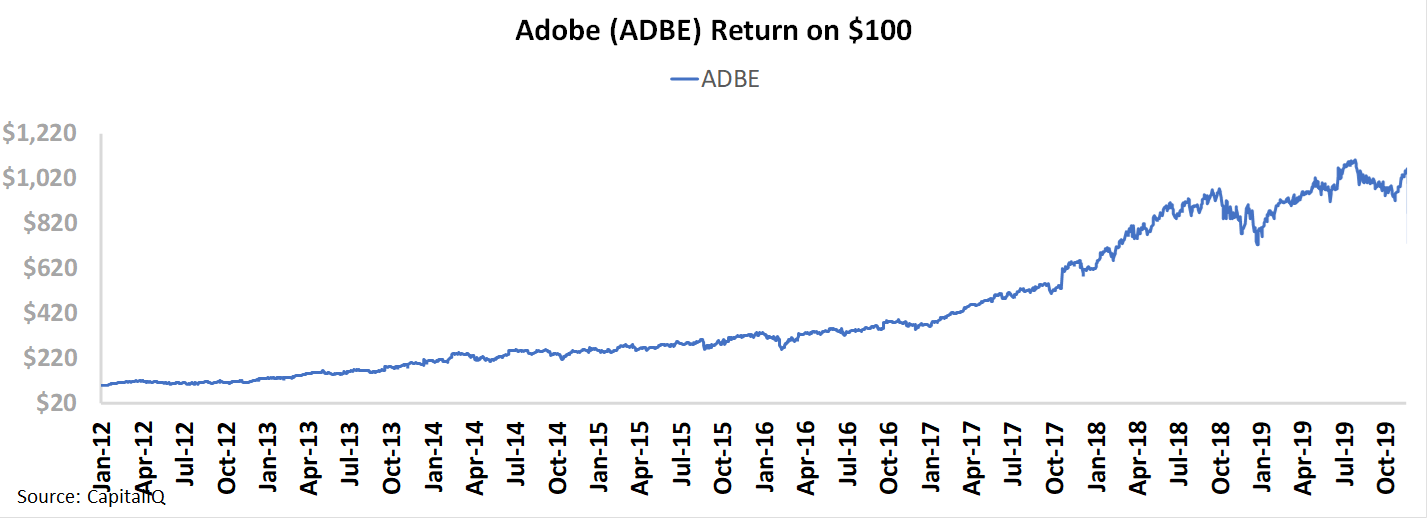
Tellingly, even when Adobe was struggling in 2013 and 2014 to show growth, the market believed in the company’s strategy, and the power of the conversion to a subscription business. By the time the company reported that subscription revenue had exceeded product revenue for FY 2014, the stock had already more than doubled from pre-announcement levels.
The market understood that while the company might not make as much up front from each customer, the lifetime value of their customers was going to rise, as the smaller monthly payment was stickier and less of a perceived burden than those big ticket prices Adobe previously offered.
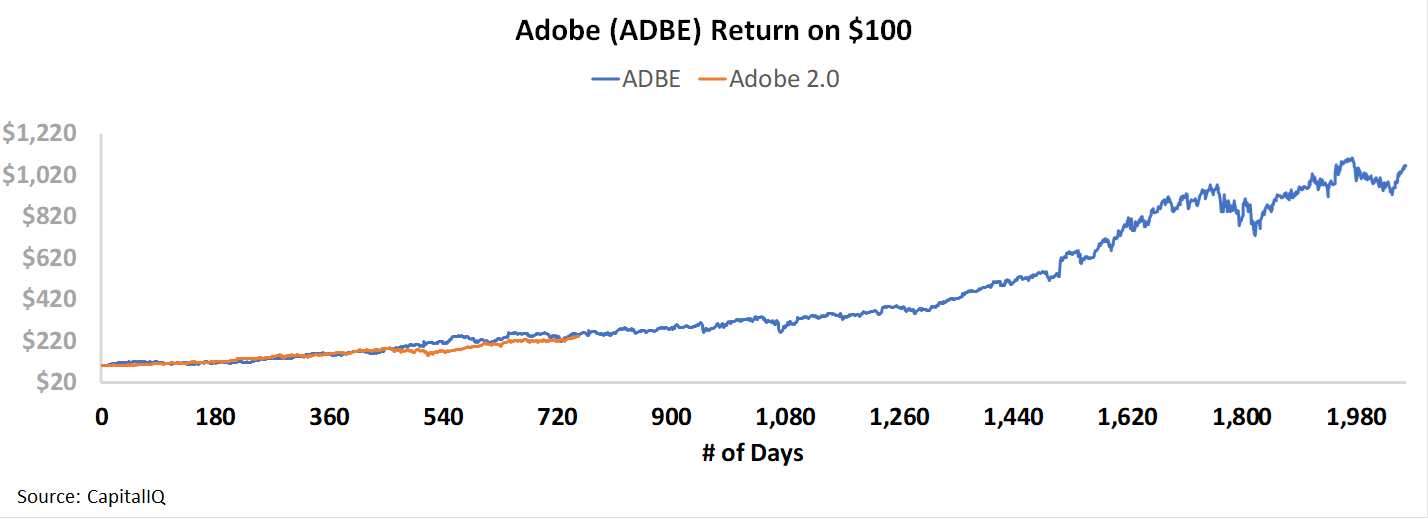
So it caught our attention, and the market’s, when another big software company started copying Adobe’s playbook in 2017. The company started converting all their products to a subscription model, and upselling customers solutions on their cloud, much like Adobe.
As the company has been following Adobe’s playbook, their stock price has been following the playbook too…
Microsoft had actually started to move into the subscription space as long ago as Adobe. In 2011, they started to emphasize the Office 365 offering, giving users the ability to subscribe to their software, as opposed to buying office each time they bought a new computer or wanted an upgrade. But the 2017 decision was a watershed moment. The company announced Microsoft 365, a bundle of all their software for business or personal use and started to push customers to convert to the new model.
This was also part of a major shift for Microsoft under Satya Nadella, as Microsoft has also focused on Azure and their cloud offerings. This model supports their subscription business.
Similar to Adobe, Microsoft saw Uniform ROA start to inflect higher in short order. Returns rose from historically low 28% levels in 2017 up to 34% by fiscal 2019. This year they are forecast to rise to 37% levels. Microsoft is seeing the exact same inflection Adobe saw, but the market isn’t reacting like it’s already seen this playbook. Microsoft’s stock is exactly where Adobe’s was, at the same stage of their journey.
If this keeps up, Microsoft’s stock price could have significant upside. The market is not yet pricing in the potential for returns to continue to rise higher.
With management showing confidence about improved revenue growth for their products, the adoption of the Microsoft 365 suite, and around their strategic partnerships, it appears that the markets may need to start to realize that Microsoft really is Adobe 2.0, with a $1 trillion market cap behind it…
Join us for today’s Market Phase Cycle release webinar
One of the most important indicators of the recessionary risk is access to credit in the market.
A key indicator we monitor around access to credit just inflected negatively.
In the same month, we also saw one of our most important signals around earnings growth turn positive.
What does that mean for our market outlook?
You are invited to attend a webinar to hear about the latest macro insights on the markets.
Valens Market Phase Cycle™ uses a framework powered by better financial and market metrics, to be able to simplify the signals the market is seeing. By starting with market cycles, and drilling down into equity and credit valuations and market sentiment in a consistent repeatable way, we can help you see better short-term and long-term signals for client asset allocation.
Our Director of Research will be reviewing this month’s Market Phase Cycle, our systematic macro analysis, discussing how looking at a consistent framework and cleaned-up analytics is so important for investors, and giving a quick introduction to using our platform, the Valens Research app.
The webinar will be Friday, 11/22, at 12pm EST, and will be less than 30 minutes
If you are interested in attending, please register below.
Register for this 30-minute webinar on using superior macro research.
Friday, November 22nd, 2019
12:00pm to 12:30pm
Market expectations are for fading Uniform ROA, but management is confident about their partnerships, revenue, and Microsoft 365
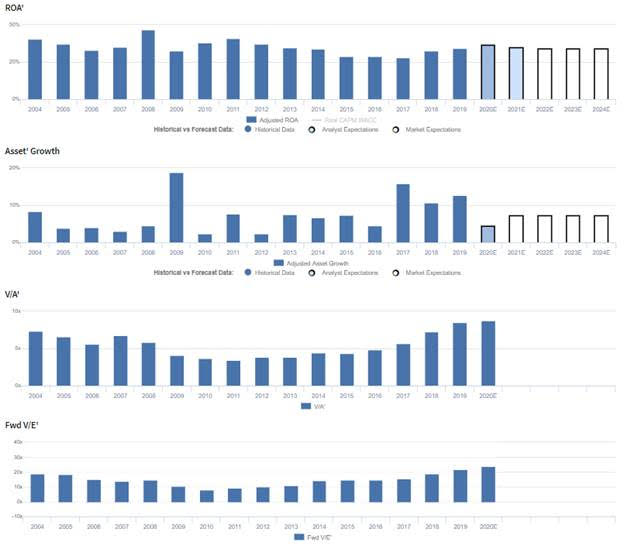
MSFT currently trades at historical highs relative to UAFRS-based (Uniform) Earnings, with a 23.6x Uniform P/E. However, even at these levels, the market is pricing in expectations for Uniform ROA to remain at 34% levels through 2024, accompanied by 7% Uniform Asset growth going forward.
However, analysts have bullish expectations, projecting Uniform ROA to expand to 35% in 2021, accompanied by 5% Uniform Asset growth.
Historically, MSFT has seen robust, somewhat cyclical profitability, with Uniform ROA ranging from 29%-47%, and with recent declines driven by competitive pressures in their cloud business. After the turn of the century, Uniform ROA fell from 40% in 2004 to 33% in 2006, before rebounding to a high of 47% in 2008. However, Uniform ROA subsequently dropped to 33% in 2009, and despite recovering back to 41% in 2011, steadily declined to just 29% in 2016. Since then, Uniform ROA has improved to 34% in 2019. Meanwhile, Uniform Asset growth has been consistent, though volatile, positive in each of the last sixteen years, while ranging from 2%-19% since 2004.
Performance Drivers – Sales, Margins, and Turns
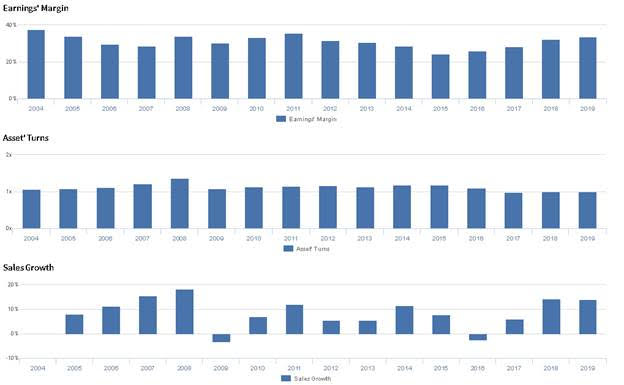
Trends in Uniform ROA have been driven by the firm’s ability to offset declining Uniform Earnings Margin with improvements in Uniform Asset Turns, and vice versa. While Uniform Margins declined from 38% in 2004 to 29% in 2007, Uniform Turns improved from 1.1x in 2004 to 1.4x in 2008. However, since the Great Recession, this inverse relationship has been weaker, and the firm has seen Uniform ROA compression as a result. After regressing to 1.1x in 2009, Uniform Turns stabilized at 1.1x-1.2x levels through 2016, before declining to just 1.0x in 2017-2019. Meanwhile, despite recovering to 36% in 2011, Uniform Margins declined to just 24% in 2015, before expanding to 34% in 2019. At current valuations, markets are pricing in expectations for Uniform Margins and Turns to remain stable.
Earnings Call Forensics
Valens’ qualitative analysis of the firm’s Q1 2020 earnings call highlights that management is confident their strategic partnerships add value through managing the entire data estate and that their operating expenses were lower than expected for the quarter. Furthermore, they are confident their continued revenue growth has been driven by demand for their Azul Hybrid product, and they are confident about the long-term viability of their Microsoft 365 suite.
However, management is also confident they will see greater year-over-year capex spend, and they may lack confidence in their ability to integrate their portfolio offerings. Furthermore, they may be concerned about the strength of their AI tools, and they may lack confidence in their ability to further develop AI beyond their competitors. Finally, they may be concerned about the value of their gaming investments in the cloud and about further pressure to entry-level products in the OEM space.
UAFRS VS As-Reported

Uniform Accounting metrics also highlight a significantly different fundamental picture for MSFT than as-reported metrics reflect. As-reported metrics can lead investors to view a company to be dramatically stronger or weaker than real operating fundamentals highlight. Understanding where these distortions occur can help explain why market expectations for the company may be divergent.
As-reported metrics significantly understate MSFT’s profitability. For example, as-reported ROA for MSFT was 10% in 2019, substantially lower than Uniform ROA of 34%, making MSFT appear to be a much weaker business than real economic metrics highlight. Moreover, since emerging from the recession in 2009, as-reported ROA has fallen by nearly half, from 17% to 10%, while Uniform ROA has improved from 33% to 34%, directionally distorting the markets perception of the firm’s historical performance trends.
Today’s Tearsheet
Today’s tearsheet is for Unilever. Unilever trades at a slight premium to market average valuations. The company has recently had robust Uniform EPS growth, and after a dip in 2019 is forecast to see earnings growth resume in 2020. At current valuations, the market is pricing in the company’s slower earnings growth going forward, implying the market may correctly understand Unilever’s fundamentals. The company’s earnings growth for 2019 is below peer average levels, but the company trading at a premium to peer average valuations. The company has strong returns, with no risk to their dividend.
Regards,
Joel Litman
Chief Investment Strategist