Loyalty programs are the diamond in the rough for the airline industry, and Uniform Accounting shows how this firm takes advantage

For airlines, the loyalty program can be as valuable as the core business itself. Today’s company controls this vital marketing tool.
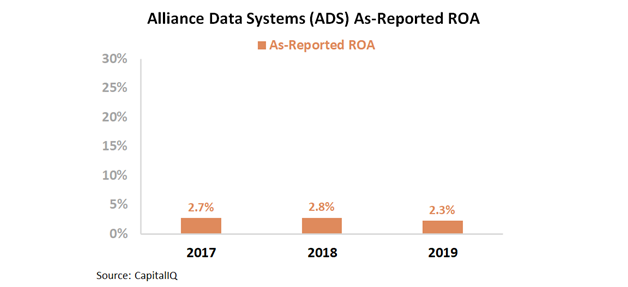
Looking at as-reported numbers, it appears today’s firm generates below cost-of-capital returns. Digging deeper into the numbers, we can see the firm has stronger profitability than the market thinks.
Also below, the company’s Uniform Accounting Performance and Valuation Tearsheet.
Investor Essentials Daily:
Thursday Tearsheets
Powered by Valens Research
Airlines are struggling to stay afloat. Demand has faltered during the pandemic and prices on most flights are the lowest they have been in decades. Even with government aid, airlines have fired or furloughed tens of thousands of employees.
To stay alive, management teams have been getting creative. The latest strategy is to borrow against one of their most valuable assets…the airline miles.
The loyalty program and airline mile industry is massive. It’s so large that there are publications like The Points Guy focused on how to value and use them properly.
Additionally, some estimates put the value of loyalty programs for Delta (DAL), American Airlines (AAL), and United (UAL) at more than their respective market capitalizations.
While these programs are important to airlines, most firms lack the skills to run them successfully. Management teams are too busy running the transportation business. As such, vendors oversee the programs, with the largest being Alliance Data Systems (ADS).
Alliance Data Systems operates throughout Canada and the United States. In Canada, Alliance Data operates LoyaltyOne, a loyalty program for several industries. One of those is the national Air Miles program, which two-thirds of Canadian households are a part of.
Additionally, Alliance Data operates card programs for retail brands such as Victoria’s Secret, Eddie Bauer, and many other brands.
Given the value of such programs and Alliance Data’s positioning in the airline rewards industry, investors might assume the firm has high returns. However, as-reported ROA appears to be weak and stagnant. Over the past three years, Alliance Data’s ROA has ranged between 2% and 3%.
Looking at these returns, investors might wonder if the airline’s loyalty reward systems are as valuable as estimates say they are. This picture of Alliance Data’s profitability is not accurate.
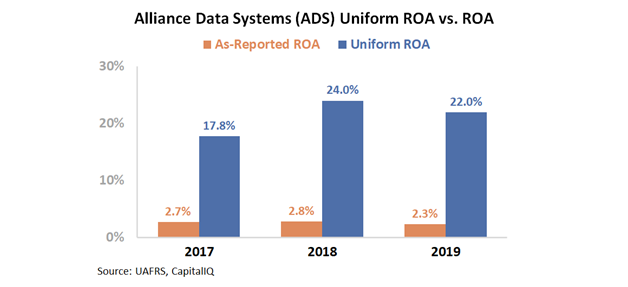
GAAP’s treatment of special items and interest expenses, among other distortions, is suppressing the firm’s profitability.
In reality, Alliance Data has sustained profitability levels well in excess of the firm’s cost of capital. Uniform ROA over the past three years has ranged between 18% and 24%.
We know the market is missing the mark on the firm’s profitability. Now, we need to see what the market is expecting the firm to do over the next five years. To look at Alliance Data’s expectations, we can use our Embedded Expectations framework.
Most investors determine stock valuations using a discounted cash flow (DCF) model. A DCF model uses investors’ assumptions about the future, which then produces the “intrinsic value” of the stock.
However, here at Valens, we know models with garbage-in assumptions only come out as garbage. Therefore, we turn the DCF model on its head in the below chart. Here, we use the current stock price to solve for what returns the market expects the firm to make.
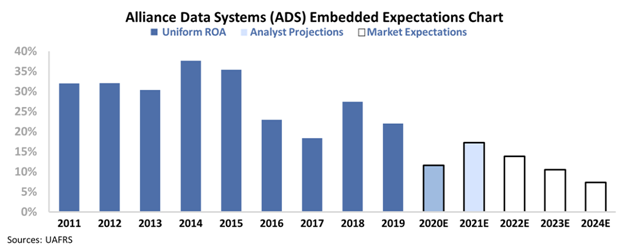
The dark blue bars represent the historical corporate performance levels, in terms of ROA. The light blue bars are Wall Street analysts’ expectations for the next two years. Finally, the white bars are the market’s expectations for how ROA will shift in the next five years.
From the below graph, we can see Wall Street is expecting Uniform ROA to dip this year due to coronavirus-related headwinds. Then, analysts expect Uniform ROA to rebound to 20% in 2021. After that, the market is pricing in Uniform ROA to fall all the way to 8% through 2024.
This would be the lowest profitability level for the firm since at least 2004. Alliance Data is having a tough year because some of its corporate clients have declared bankruptcy and airlines have less demand. However, these are only short-term headwinds.
There will always be a need for airlines, and retailers should return to normal once a vaccine arrives. While Alliance Data may have one or two years with lower profitability, a five year stretch seems unlikely.
Uniform Accounting shows Alliance Data is more profitable than the market thinks. Additionally, the market is expecting profitability to crater over the following years.
Although Alliance Data faces some headwinds, it may be a stock to follow if the firm is able to sustain profitability levels.
SUMMARY and Alliance Data Systems Corporation Tearsheet
As the Uniform Accounting tearsheet for Alliance Data Systems Corporation (ADS:USA) highlights, the Uniform P/E trades at 9.5x, which is below the global corporate average valuation levels and its historical average valuations.
Low P/Es require low EPS growth to sustain them. In the case of ADS, the company has recently shown a 3% Uniform EPS decline.
Wall Street analysts provide stock and valuation recommendations that in general provide very poor guidance or insight. However, Wall Street analysts’ near-term earnings forecasts tend to have relevant information.
We take Wall Street forecasts for GAAP earnings and convert them to Uniform earnings forecasts. When we do this, ADS’ Wall Street analyst-driven forecast is a 48% EPS shrinkage in 2020, followed by a 43% EPS growth 2021.
Based on the current stock market valuations, we can use earnings growth valuation metrics to back into the required growth rate to justify ADS’ $59 stock price. These are often referred to as market embedded expectations.
The company can have an 18% Uniform earnings shrinkage each year over the next three years and still justify current market expectations. What Wall Street analysts expect for ADS’ earnings growth is below what the current stock market valuation requires in 2020, but above its requirement in 2021.
Furthermore, the company’s earning power is 4x the corporate average. However, cash flows and cash on hand are below its total obligations—including debt maturities, capex maintenance, and dividends. Together, this signals a high credit and dividend risk.
To conclude, ADS’ Uniform earnings growth is below peer averages and the company is also trading below its average peer valuations.
Best regards,
Joel Litman & Rob Spivey
Chief Investment Strategist &
Director of Research
at Valens Research


