
After cleaning up GAAP’s blemishes from this skin care and fragrance firm, we can see why it’s been crushing the market

Today’s firm is a great example of how smaller investors are locked out of alpha thanks to GAAP metrics throwing off analysis.
Looking at as-reported numbers might make investors think Estée Lauder is poor performing and has no competitive advantage. Digging deeper, we can see the firm has stronger profitability than GAAP thinks.
Also below, the company’s Uniform Accounting Performance and Valuation Tearsheet.
Investor Essentials Daily:
Tuesday Tearsheets
Powered by Valens Research
Here at Valens, we field a sizable number of questions about what makes us different from other research firms. We often tell investors to ignore the common but misleading metrics teachers and television pundits espouse and to instead focus on adjusted metrics like our Uniform Accounting framework.
Some of the most common questions about Uniform Accounting are “If the entire market is looking at as-reported accounting, why do your numbers matter,” and “when does the market figure it out? Could you be sitting on a value trap for years in the meantime?”
These are great questions, and we think it’s important to understand that we’re not alone in adjusting the as-reported financials.
9 of the world’s 10 biggest institutional investors read our work, along with 230 of the top 300 asset managers. Additionally, almost all of those firms have their own internal version of Uniform Accounting.
BlackRock (BLK), a firm with over $7 trillion in assets under management, hires dozens of professors with PhDs in fields like accounting, tax law, and economics. BlackRock uses this team to restate accounting data before it does any serious quantitative analysis.
BlackRock and other institutions understand the noise inherent in as-reported accounting and its need to be systematically fixed.
Additionally, the Uniform Accounting framework is more holistic than just the updated financials. We also use incentives-based research, macroeconomic conditions, and earnings call analysis to determine great investments.
With all of these tools, we’re able to better understand why stocks perform the way they do. In reality, stocks track Uniform Accounting-based fundamentals far better than they track the as-reported metrics.
An excellent example of this is Estée Lauder (EL). Estée Lauder is one of the largest manufacturers of skin care, makeup, and other beauty products. The firm operates in over 150 countries and has dozens of brands under its portfolio.
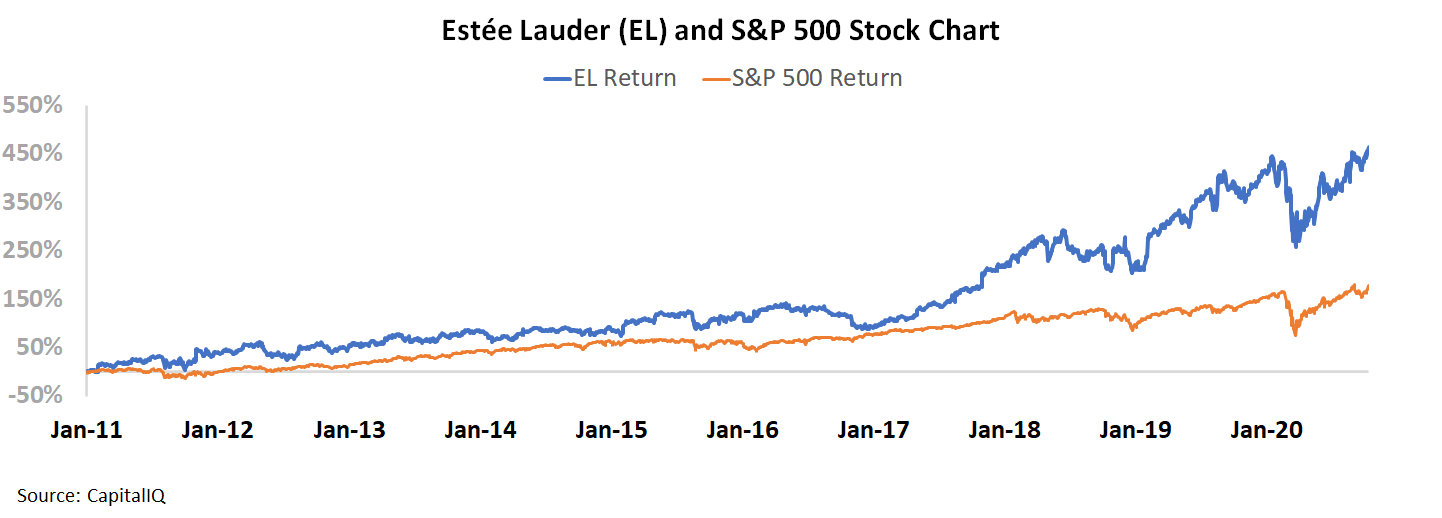
Estée Lauder’s stock has been a rocket ship over the past decade. Since the beginning of 2011, the stock is up over 500%. This is far more appreciation than the S&P 500, which is up almost 200% over the same period.
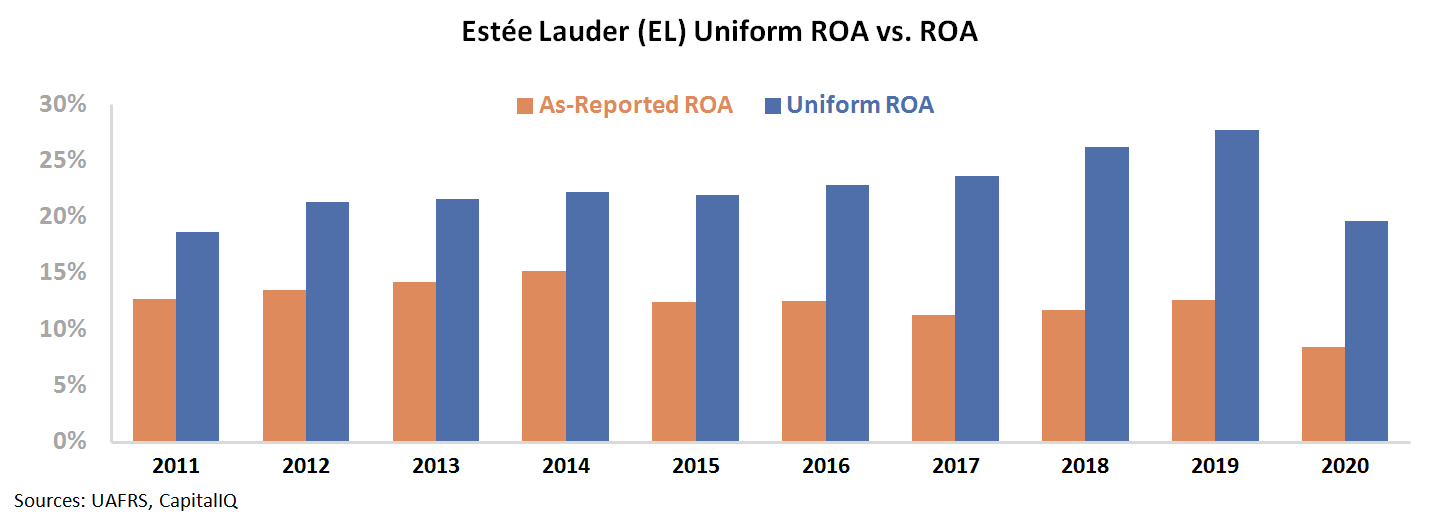
Looking at as-reported ROA, there’s no clear catalyst for Estée Lauder’s performance. Over the past 10 years, the firm’s ROA appears to have ranged near corporate average levels, falling from 14% in 2011 to just 9% this past fiscal year.

However, this depiction of the firm’s performance is not accurate.
GAAP’s treatment of excess cash and special items, among other distortions, is suppressing Estée Lauder’s profitability.
Uniform Accounting shows how consistent and robust the firm’s performance has been. Other than the 2020 fiscal year, which was hurt by the coronavirus pandemic, Uniform ROA has been improving over the past decade.
Uniform ROA was 19% in 2011 and reached a high of 28% in 2019. Estée Lauder’s Uniform ROA expansion lines up well with its stock performance over the last decade.
Uniform Accounting shows how successful Estée Lauder has been since 2011. Furthermore, on a larger scale, this example shows how the market is more in line with Uniform metrics that you might think.
Using only as-reported metrics, investors could never understand the firm’s stock appreciation, but Uniform Accounting makes this meteoric rise become obvious.
SUMMARY and The Estée Lauder Companies Inc. Tearsheet
As the Uniform Accounting tearsheet for The Estée Lauder Companies Inc. (EL:USA) highlights, the Uniform P/E trades at 42.3x, which is above the global corporate average valuation levels and its historical average valuations.
High P/Es require high EPS growth to sustain them. In the case of The Estée Lauder Companies Inc., the company has recently shown a 24% decline in Uniform EPS.
Wall Street analysts provide stock and valuation recommendations that provide very poor guidance or insight in general. However, Wall Street analysts’ near-term earnings forecasts tend to have relevant information.
We take Wall Street forecasts for GAAP earnings and convert them to Uniform earnings forecasts. When we do this, The Estée Lauder Companies Inc.’s Wall Street analyst-driven forecast is a 33% and an 19% EPS growth in 2021 and 2022, respectively.
Based on the current stock market valuations, we can use earnings growth valuation metrics to back into the required growth rate to justify The Estée Lauder Companies Inc.’s $246 stock price. These are often referred to as market embedded expectations.
In order to justify current stock prices, the company would need to have Uniform earnings grow 23% per year over the next three years. What Wall Street analysts expect for The Estée Lauder Companies Inc.’s earnings growth is above what the current stock market valuation requires in 2021 and 2022.
Furthermore, the company’s earning power is 3x the long-run corporate averages. Additionally, cash flows and cash on hand are well above its total obligations—including debt maturities, capex maintenance, and dividends. Altogether, these signals a low credit and dividend risk.
To conclude, The Estée Lauder Companies Inc.’s Uniform earnings growth is above its peer averages, and the company is trading above its peer average valuations.
Best regards,
Joel Litman & Rob Spivey
Chief Investment Strategist &
Director of Research
at Valens Research


