This busted convert is offering yields that would make one think it’s going under…Uniform Accounting shows it isn’t

This company has bonds yielding 10%, with a small kicker, as bond markets continue to be concerned about its ability to remain solvent.
However, when we look at the company’s TRUE outlook, based on UAFRS-driven analysis, it’s apparent that the markets are way too pessimistic.
Below, we show how Uniform Accounting restates financials for a clear credit profile. We also provide the equity tearsheet showing Uniform Accounting-based Performance and Valuation analysis of the company.
Investor Essentials Daily:
Wednesday Credit Insights
Powered by Valens Research
In 1842, the Watertown & Rome Railroad was started in order to link Watertown and Rome, New York.
In 1861, this railroad merged with the Potsdam & Watertown Railroad to become the “Rome, Watertown, & Ogdensburg Railroad,” or because that is a bear to say, “RW&O.” The company was laying track and consolidating the space.
This capital intensive business regularly required new money. As a result, in 1874, RW&O tried a new way to raise capital and issued the first ever convertible bond.
Although “converts” have developed significantly in the ~150 years since RW&O issued the first one, the mechanics are largely the same. Owners get a fixed payment for owning the bond until its maturity, but also have the option to turn in their bonds for equity in the underlying business.
In the vanilla version, the bond owner gets the option to convert the bond into a certain number of shares of the company. Using simple arithmetic, investors can find the price at which it makes sense to convert to equity, by dividing the price of the bond by the number of shares received.
When the price of the company’s stock is well above that “convert price,” the bond trades like the stock.
An example of this in a company we’ve written credit reports about in the past, Advanced Micro Devices (AMD). We’ve even been featured in Barron’s discussing this name.
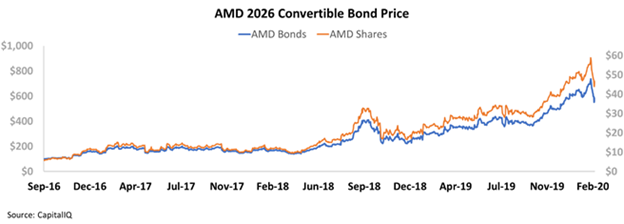
Take a look at AMD’s 2026 convertible bond price since 2016:
The stock and the convertible bonds effectively trade in lockstep.
However, when the price falls well below, investors treat it like a regular bond instrument. This is what happened to the bond we’re focusing on today.
When this happens, credit investors call the instrument a “busted convert.” It’s busted because the bond no longer has the characteristics that make convertible bonds compelling, the upside potential from the stock warrants you get with the bond.
When a convertible bond “busts,” it can become something of an orphan. The bond’s convertible nature makes it not appear on many credit investors screens, but the limited intrinsic value means it doesn’t appear on equity and convertible investors screens either.
The below chart compares AMAG Pharmaceuticals’ 2022 Convertible Bond price to the company’s share prices since the bond was issued:
There is a limited relationship between the two. Just like your standard bond and stock.
That is because AMAG shares are trading at just $8 right now, well below the $27 price that would make conversion a good option. In fact, if you look at the chart during the summer of 2018, when AMAG shares approached $27, the bond did start trading more like the equity.
However, since then, shares have gotten crushed, and the bond is again trading like a standard bond.
As a result, we can analyze the bond like a standard bond, by looking at the cash flows and obligations of the firm, and whether we have any concerns about it remaining a going concern.
At its current price, AMAG’s 2022 Bond has a Yield to Worst (YTW) of over 10%. For the next two years, investors can get a 10% yield, and that’s ignoring the small possibility that shares get back to levels making conversion worthwhile.
Usually bonds trading at these levels suggest a company with a concerning outlook. With only two years remaining until maturity, and that 10% yield, concerns about AMAG’s profitability appear significant.
But these concerns are unfounded.
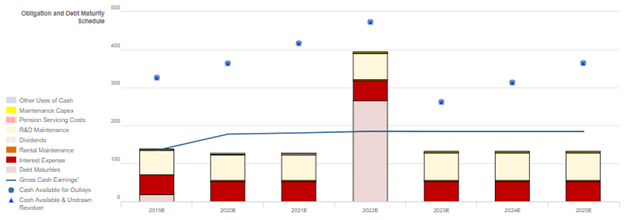
The below chart highlights all of AMAG’s projected cashflows relative to its obligations for the next several years:
The firm is projected to have cash flows over obligations in each year other than when the 2022 bonds come due. Also, by then, it is projected to have built the cash stores to service its debt headwall. This isn’t the outlook of a firm we’d expect to have a 10% yield.
Even if the company were to see cash flows and cash on hand fall short of obligations, its biggest obligation is R&D maintenance.
This company is plowing money into research, and in the event it needed to reduce spend, it could cut back here and service its debt. That would potentially be bad for the equity, and maybe investors wouldn’t be able to convert these bonds, but a 10% return is more than sufficient return.
AMAG is a great example of how sometimes a busted convertible bond can mean a compelling investing opportunity to those who see through the accounting and market noise.
Robust recovery rate, strong expected cash build, and operational sustainability indicate that credit markets are grossly overstating credit risk
Credit markets are grossly overstating credit risk with a cash bond YTW of 10.631%, relative to an Intrinsic YTW of 5.121% and an Intrinsic CDS of 359bps.
Additionally, Valens rates AMAG as an investment grade IG4+ (Baa1) credit.
Fundamental analysis highlights that AMAG’s cash flows should exceed operating obligations in each year going forward.
Moreover, the combination of the firm’s cash flows and expected cash build would be sufficient to service all obligations through 2025, including a material $265mn debt maturity in 2022.
Furthermore, the firm boasts a robust 180% recovery rate, which should allow them to access credit markets to refinance, despite their minimal market capitalization.
Incentives Dictate Behavior™ analysis highlights mixed signals for AMAG’s credit holders.
AMAG’s compensation structure focuses management on top-line growth and margin expansion, but does not punish them for overleveraging the firm’s balance sheet to drive growth.
Moreover, most management members, excluding CEO Heiden, are not material owners of AMAG equity relative to their average annual compensation, indicating they may not be well aligned with shareholders for long-term value creation.
However, due to his significant holdings, CEO Heiden may convince other NEOS to do otherwise.
Furthermore, management members are not well-compensated in a change in control, indicating that they are unlikely to pursue a sale or accept a buyout of the firm, reducing event risk for creditors.
Earnings Call Forensics™ of the firm’s Q3 2019 earnings call (11/1) highlights that management may be concerned about negative Makena IM revenues, the progress of AMAG-423 Phase III trial enrollment, and their estimated Medicaid liabilities.
In addition, they may lack confidence in their ability to sustain Intrarosa and Makena subcu auto-injector sales growth, and they may be exaggerating Feraheme market growth potential.
Finally, they may be concerned about ongoing conversations with the FDA regarding Makena.
AMAG’s robust recovery rate, sizeable expected cash build, and operational sustainability indicate that credit markets are grossly overstating fundamental credit risk. As such, a tightening of credit spreads is likely going forward.
SUMMARY and AMAG Pharmaceuticals, Inc. Tearsheet
As the Uniform Accounting tearsheet for AMAG Pharmaceuticals, Inc. (AMAG) highlights, the company’s Uniform P/E trades at 3.1x, which is well below both corporate average valuation levels and its historical valuations.
Low P/Es require low, and even negative, EPS growth to sustain them. In the case of AMAG Pharmaceuticals, the company has recently seen its Uniform EPS decline, which may be a signal that below-average valuations are justified.
Wall Street analysts provide stock and valuation recommendations that in general provide very poor guidance or insight. However, Wall Street analysts’ near-term earnings forecasts tend to have relevant information.
We take Wall Street forecasts for GAAP earnings and convert them to Uniform earnings forecasts. When we do this, AMAG Pharmaceuticals, Inc.’s Wall Street analyst-driven EPS is forecast to decline by 62% in 2019. That will grow by 161% in earnings in 2020.
Based on current stock market valuations, we can back into the required earnings growth rate that would justify $8 per share. These are often referred to as market embedded expectations. In order to meet the current market valuation levels for AMAG Pharmaceuticals, the company would have to have Uniform earnings shrink by 31% each year over the next three years.
What Wall Street analysts’ expectations for AMAG’s earnings growth are below what the current stock market valuation requires in 2019, but is far above the requirement in 2020.
In addition to AMAG’s valuations is low, its Uniform P/E is well below peer averages, while its Uniform EPS growth is significantly higher than peer averages.
Meanwhile, the company’s earnings power is 5x higher than corporate averages, signaling very low risk to its dividend or operations.
To summarize, AMAG Pharmaceuticals is expected to see below average Uniform earnings growth in 2019, which is not expected to continue in 2020. Furthermore, the company is trading above average peer valuations.
Best regards,
Joel Litman & Rob Spivey
Chief Investment Strategist &
Director of Research
at Valens Research


