
With another volatility this year, quant funds are poised to benefit again in 2023

Volatility is a bad word for a lot of investors. It leads to fear and panic when the market is falling and to overconfidence and exuberance when the market is rising.
If they could, most investors would probably vote to get rid of volatility but one group of investors would veto that, which is the quant funds.
Quant funds tend to do well in a highly volatile environment as their strategy usually focuses on taking advantage of price discrepancies in the market with high-frequency trading algorithms.
With continued Fed rate hikes and a bona fide bank crisis, it looks like we are about to see another year with high volatility in the market. Using the Uniform Accounting framework, we’re taking a look at one of the leading quant funds, Two Sigma Investments.
In addition to examining the portfolio, we include a deeper look into the fund’s largest current holding, providing you with the current Uniform Accounting Performance and Valuation Tearsheet for that company.
Also below is a detailed Uniform Accounting tearsheet of the fund’s largest holding.
Investor Essentials Daily:
Friday Uniform Portfolio Analytics
Powered by Valens Research
Volatility has been a major concern for many investors, as it creates uncertainty in the market and can lead to significant price swings.
However, one particular group of investors or traders benefit from volatility—the quant funds.
These funds have been able to thrive in volatile markets by using techniques like high-frequency trading algorithms and advanced statistical models to identify opportunities and generate profits.
Due to their ability to process and analyze vast amounts of data quickly and accurately, they can identify patterns and trends in the market and act on them in real time.
This can be particularly beneficial in volatile markets, where prices can change rapidly and investors need to react quickly to take advantage of opportunities.
Because of these factors, quant funds are usually well-positioned to navigate a highly volatile market environment and generate alpha.
Last year was quite volatile, and that made it one of the best years in decades for quant funds.
For instance, one of the leading quant shops, Two Sigma Investments, returned about 25% when the broader market fell by almost 20%.
That’s a massive amount of alpha. So far, it appears that 2023 will also be in favor of quant funds.
The volatility in the market has been increasing significantly this year due to continued rate hikes by the Fed and the regional bank crisis we have been experiencing recently.
In light of this, let’s have a look at Two Sigma’s top holdings and see if they can continue to provide high returns for its investors.
Economic productivity is massively misunderstood on Wall Street. This is reflected by the 130+ distortions in the Generally Accepted Accounting Principles (GAAP) that make as-reported results poor representations of real economic productivity.
These distortions include the poor capitalization of R&D, the use of goodwill and intangibles to inflate a company’s asset base, a poor understanding of one-off expense line items, as well as flawed acquisition accounting.
It’s no surprise that once many of these distortions are accounted for, it becomes apparent which companies are in real robust profitability and which may not be as strong of an investment.
See for yourself below.
Looking at as-reported accounting numbers, investors would think that investing with Two Sigma Investments is not really rewarding.
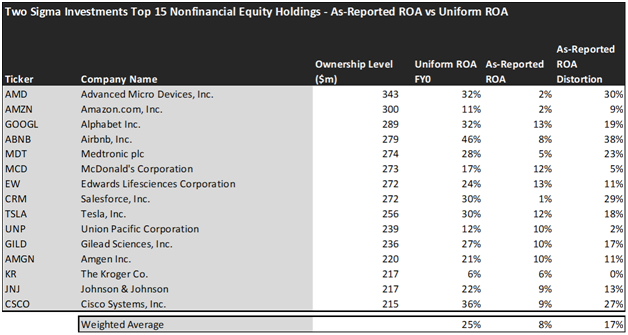
On an as-reported basis, many of the companies in the fund are poor performers. The average as-reported ROA for the top 15 holdings of the fund is 8%, which is significantly below the U.S. corporate average.
However, once we make Uniform Accounting adjustments to accurately calculate the earning power, we can see that the average return in Two Sigma Investments’ top 15 holdings is actually 25%.
As the distortions from as-reported accounting are removed, we can see that Airbnb (ABNB) isn’t an 8% return business. Its Uniform ROA is 46%.
Meanwhile, Advanced Micro Devices (AMD) looks like an unprofitable company with only 2% return, but this massive semiconductor company powers a 32% Uniform ROA.
That being said, to find companies that can deliver alpha beyond the market, just finding companies where as-reported metrics misrepresent a company’s real profitability is insufficient.
To really generate alpha, any investor also needs to identify where the market is significantly undervaluing the company’s potential.
These dislocations demonstrate that most of these firms are in a different financial position than GAAP may make their books appear. But there is another crucial step in the search for alpha. Investors need to also find companies that are performing better than their valuations imply.
Valens has built a systematic process called Embedded Expectations Analysis to help investors get a sense of the future performance already baked into a company’s current stock price. Take a look:

This chart shows four interesting data points:
- The average Uniform ROA among Two Sigma Investments’ top 15 holdings is actually 25% which is much better than the corporate average in the United States, which is closer to 12%.
- The analyst-expected Uniform ROA represents what ROA is forecasted to do over the next two years. To get the ROA value, we take consensus Wall Street estimates and convert them to the Uniform Accounting framework.
- The market-implied Uniform ROA is what the market thinks Uniform ROA is going to be in the three years following the analyst expectations, which for most companies here are 2023, 2024, and 2025. Here, we show the sort of economic productivity a company needs to achieve to justify its current stock price.
- The Uniform P/E is our measure of how expensive a company is relative to its Uniform earnings. For reference, the average Uniform P/E across the investing universe is roughly 20x.
An Embedded Expectations Analysis of Two Sigma Investments paints a clear picture. Over the next few years, Wall Street analysts expect the companies in the fund to remain flat in profitability and the market agrees.
Analysts forecast the portfolio holdings on average to see Uniform ROA remain flat to 25% over the next two years. At current valuations, the market’s expectations are in line with analysts and it expects a 25% Uniform ROA for the companies in the portfolio as well.
For instance, Amgen (AMGN) returned 21% this year. Analysts think its returns will remain flat at current levels. And at a 14.3x Uniform P/E, the market expects profitability to be around this level with only a slight decline and is pricing Uniform ROA to be around 18%.
Similarly, Union Pacific Corporation’s (UNP) Uniform ROA is 12%. Analysts expect its returns will be at the same levels over the next two years, but the market has a slightly more optimistic outlook and pricing its returns to be around 15%.
In conclusion, we can see that Two Sigma Investments have some high-quality names among its top holdings that can provide high returns to investors.
But it’s important to note that the fund’s focus is on taking advantage of short-term price discrepancies and volatility in the market which could be risky and might not align with every investor’s strategy.
Additionally, the market’s expectations are limiting the upside potential as the market is already pricing in a certain level of profitability for the companies in the fund’s top holdings.
That is why investors should be cautious and analyze the current valuations and the market’s expectations before jumping on an investment opportunity.
This just goes to show the importance of valuation in the investing process. Finding a company with strong profitability and growth is only half of the process. The other, just as important part, is attaching reasonable valuations to the companies and understanding which have the upside that has not been fully priced into their current prices.
To see a list of companies that have great performance and stability also at attractive valuations, the Valens Conviction Long Idea List is the place to look. The conviction list is powered by the Valens database, which offers access to full Uniform Accounting metrics for thousands of companies.
Click here to get access.
Read on to see a detailed tearsheet of one of Two Sigma Investments’ largest holdings.
SUMMARY and Advanced Micro Devices, Inc. Tearsheet
As one of Two Sigma Investments’ largest individual stock holdings, we’re highlighting Advanced Micro Devices, Inc. (AMD:USA) tearsheet today.
As the Uniform Accounting tearsheet for Advanced Micro Devices, Inc. highlights, its Uniform P/E trades at 25.2x, which is above the global corporate average of 18.4x, and around its historical average of 24.4x.
High P/Es require high EPS growth to sustain them. In the case of Advanced Micro Devices, Inc., the company has recently shown 15% Uniform EPS growth.
Wall Street analysts provide stock and valuation recommendations that, in general, provide very poor guidance or insight. However, Wall Street analysts’ near-term earnings forecasts tend to have relevant information.
We take Wall Street forecasts for GAAP earnings and convert them to Uniform earnings forecasts. When we do this, Advanced Micro Devices, Inc.’s Wall Street analyst-driven forecast is for EPS to shrink by 17% in 2023 and grow by 41% in 2024.
Furthermore, the company’s return on assets was 32% in 2022, which is 5x the long-run corporate averages. Also, cash flows and cash on hand consistently exceed its total obligations—including debt maturities and CAPEX maintenance. Moreover, its intrinsic credit risk is 30bps above the risk-free rate. Together, these signal low operating risks and low credit risks.
Lastly, Advanced Micro Devices, Inc.’s Uniform earnings growth is below peer averages, and above with peer valuations.
Best regards,
Joel Litman & Rob Spivey
Chief Investment Strategist &
Director of Research
at Valens Research