
Assembly Required in the Oil & Auto Markets

On May 15, 1911, many people thought that one of the richest men the world has ever seen was just taken down.
He wasn’t. John D. Rockefeller’s wealth peaked at $900 billion in today’s dollars in 1912, not because of the breakup of his empire, but because he started to give away his money. But the trust busters still won in 1911… for a time.
The Supreme Court’s decision to break up Standard Oil is viewed by many as the peak of the anti-trust efforts of the early 1900s. The company was broken up into 34 different companies.
It was the completion of the first cycle of the consolidation and deconsolidation in the oil industry. But it wasn’t the last.
The oil industry stayed fragmented until the 1970s. With the spike in oil prices in the 1970s, investing in oil was once again in vogue, and different technologies were starting to make new exploration opportunities more profitable. As money flowed back into the oil patch, consolidation began again.
Drilling companies, servicing companies, pipeline companies, all businesses that the big oil companies had been comfortable allowing to exist as independent entities started to get acquired. Oil companies didn’t want to have to pay out their vendors ever growing fees, if they could just reintegrate vertically, as they had under Rockefeller.
This consolidation continued through the 1980s and 1990s, as the majors started to reconsolidate, creating new “baby Standard Oils.” In 1998 Exxon and Mobil merged, creating the largest public oil company in the world. In 2002, Conoco and Philips merged.
But even as these mega-mergers started to occur in the late 1990s and early 2000s, another thing started to occur. A new deconsolidation of the oil patch again.
Oil companies looked at their component parts, and felt that drilling companies, pipeline companies, and the like, weren’t necessary investments in their portfolios. With oil prices at sustained low prices, owning vendors that only made money when prices were booming, and were viewed as more cyclical, didn’t make sense. They started selling those components. The second wave of consolidation and deconsolidation had started its downward phase.
This cycle of consolidation and deconsolidation is not unlike another industry that helped fuel America’s rise to the pre-eminent economic power of the 20th century. The auto industry has followed similar waves. The deconsolidation wave has been accelerating in the past 25 years, as the auto companies have come under more pressure.
In 1992, GM looked across their portfolio of assets, knowing their operations were bloated and inefficient after decades of consolidation. They identified 18 manufacturing facilities that they wanted to sell. One investor, a former Chrysler executive, stepped forward with an investor group to buy 5 of the plants that were all focused around the power train business, making the axels, drive trains, and drive lines for GM and others’ vehicles.
The investment group eventually took the company, now called American Axle (AXL), public in 1999.
By 2005, with concerns about GM’s credit, the company came under pressure, as investors were concerned their largest customer could sink them. GM almost went under in 2008 before being bailed out by the government, and invested worried about an existential crisis for American Axle. The stock broke $1.
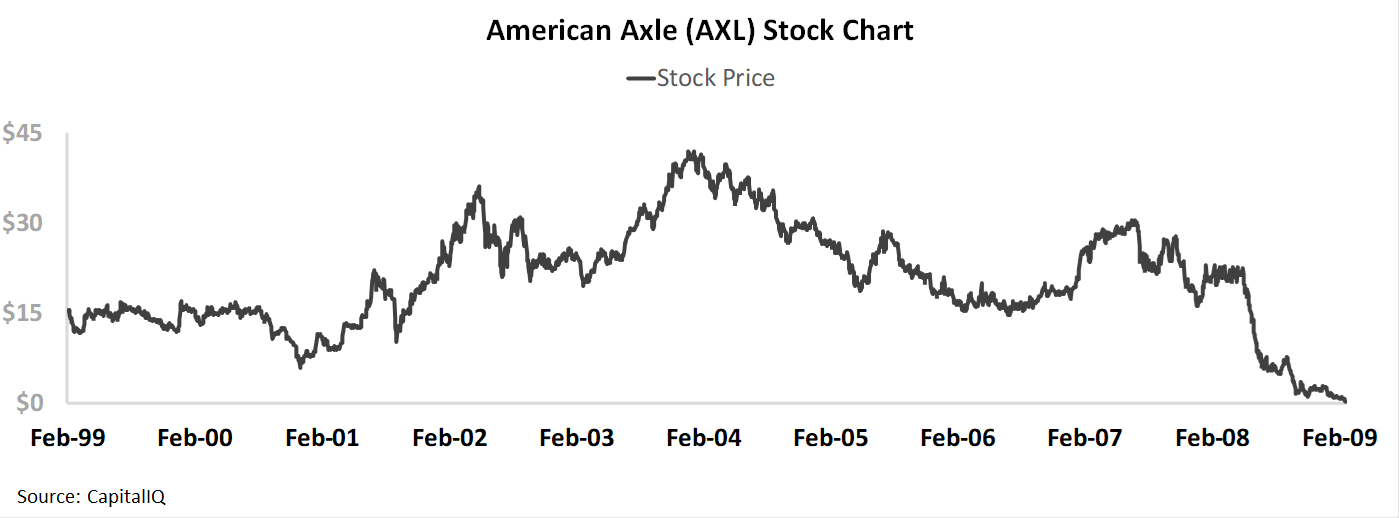
In February 2009, Uniform Accounting (UAFRS) return on assets (ROA) similarly turned negative. But American Axle had a powerful brand with their OEM customers, they had a strong technology footprint, and focused on essential innovation in their space to stay a leader in the market. Because of this, even as many of their peers had ROA that hovered around 0% for much of the 2000s and 2010s, Axle was able to regularly produce returns above 10%. Clearly Richard Dauch, who closed his acquisition of the 5 plants in 1994, knew what he was focusing on.
In 2019, the market is again pricing American Axle to see a market collapse, pricing in imminent recession risk for the company. But it looks like the market is again wrong in pricing in an existential crisis for a strong company. Axle has strong fundamentals, and not only are the fundamentals strong, management is showing confidence about fundamental drivers that may enable them to continue to exceed market expectations.
We’re Relaunching Our Portfolio Audit Review Offering – And Making A Special Offer
For our institutional clients, we don’t just provide access to our Valens Research app. We also do bespoke research. We produce one-off deep-dive company analyses using all our tools, including Uniform Accounting, credit work, and our management compensation and earnings call analysis. We monitor their portfolios for potential Uniform Accounting signals to alert them. We provide custom datasets for quantitative analysis, and provide aggregate analytics. We also help them create unique idea generation screens that are customized to their approach, using Uniform Accounting and our other analytics.
But for most of our institutional clients, the analysis that they find most useful, and almost universally ask for, is a quarterly portfolio audit and call with our analysts.
Our institutional clients pay a significant premium for all our bespoke research. Some of our institutional clients have paid well over $100,000 a year for our uniquely tailored Uniform Accounting research, because of the value it adds to their process.
Until Thanksgiving, we’re making a special offer.
For any investor that buys access to the Valens Research app ($10,000/year or $1,000/month subscription), we will include an Institutional-level portfolio audit and call with our analyst team with no extra charge.
Also, for those people who sign up to the offer before November 1st, we’ll include a lifetime access to all of our newsletters, including our Market Phase Cycle™ and Conviction Long Idea List (a $6,000 value), for no extra charge, as long as you remain a Valens Research app subscriber.
We want to help show you how powerful Uniform Accounting research can be for your investment strategy.
If you want to hear more about this offer, or are interested in subscribing, feel free to reply to this email. I’ll forward on your note to our head of client servicing. Or, feel free to reach out to Doug Haddad, the head of our client relations team, at doug.haddad@valens-securities.com or at 630-841-0683.
To read more about the offer and sign up, you can also click here.
Market expectations are for fading Uniform ROA, but management is confident about their margins, sales, and costs

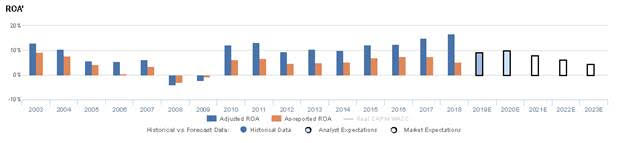
AXL currently trades below corporate averages relative to UAFRS-based (Uniform) Earnings, with a 11.9x Uniform P/E. At these levels, the market is pricing in expectations for Uniform ROA to fade from 17% in 2018 to 5% in 2023, accompanied by 4% Uniform Asset growth going forward.
Analysts have similar expectations, projecting Uniform ROA to fade to 10% in 2020, accompanied by 1% Uniform Asset shrinkage.
As an auto parts and equipment manufacturer, AXL has historically seen somewhat cyclical profitability. Prior to 2008, the firm saw Uniform ROA fall from 13% in 2003 to 5%-6% levels in 2005-2007, before seeing profitability turn negative in the wake of the Great Recession. However, after inflecting positively to 12%-13% in 2010-2011, Uniform ROA compressed to 10%-11% levels in 2012-2014, before expanding to a peak of 17% in 2018, partly driven by their Metaldyne acquisition in 2017. Meanwhile, the firm has seen somewhat volatile Uniform Asset growth, positive in 12 of the past 16 years, while ranging from -8% to 16%, excluding outlier 35% shrinkage in 2008, and 46% growth in 2017 due to the aforementioned acquisition.
Performance Drivers – Sales, Margins, and Turns
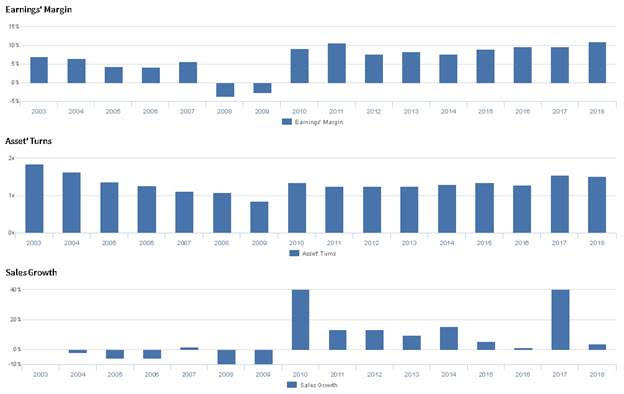
Trends in Uniform ROA have been driven by trends in both Uniform Earnings Margin and Uniform Asset Turns. Prior to 2008, Uniform Margins ranged from 4%-7%, before collapsing to negative levels during the Great Recession, and rebounding to 11% in 2011. Since then, Uniform Margins declined to 8% in 2012, before rebounding to 11% in 2018. Meanwhile, Uniform Turns faded from peak 1.8x levels in 2003 to 0.9x in 2009, before rebounding to 1.2x-1.4x levels through 2016, and expanding further to 1.5x levels in 2017-2018. At current valuations, the market is pricing in expectations for both Uniform Margins and Uniform Turns to fade materially from recent levels.
Earnings Call Forensics
Valens’ qualitative analysis of the firm’s Q2 2019 earnings call highlights that management is confident their metal forming business unit performed at over 18% EBITDA margins in Q2 and that their launch performance improvement initiative is driving higher sales. Furthermore, they are confident they are working to produce lower project expenses in 2020 and that they can offset EBITDA declines by reducing their capex spend. However, they may be concerned about the ongoing impact of headwinds they inherited from MPG, and they may lack confidence in their ability to continue realizing capacity utilization synergies. Finally, management may be concerned about continued revenue headwinds, and they may lack confidence in their ability to manage their net interest expenses.
UAFRS VS As-Reported
Uniform Accounting metrics also highlight a significantly different fundamental picture for AXL than as-reported metrics reflect. As-reported metrics can lead investors to view a company to be dramatically stronger or weaker than real operating fundamentals highlight. Understanding where these distortions occur can help explain why market expectations for the company may be divergent.
As-reported metrics significantly understate AXL’s profitability. For example, as-reported ROA for AXL was 5% in 2018, materially lower than Uniform ROA of 17%, making AXL appear to be a much weaker business than real economic metrics highlight. Moreover, since 2016, as-reported ROA has compressed from 8% to 5%, while Uniform ROA has expanded from 13% to 17% over the same timeframe, directionally distorting the market’s perception of the firm’s recent profitability trends.
Today’s Tearsheet
Today’s tearsheet is for Verizon. Verizon trades at a slight discount to market valuations. At current valuations, the market is pricing in Uniform EPS growth to be negative going forward, significantly below recent historic growth rates, and below what it is forecast to be the next 2 years. However, the company has recently had negative earnings revisions, and has limited margin of safety for their debt.
Regards,
Joel Litman
Chief Investment Strategist


