This vice stock is being priced to be more than recession proof by investors, which makes it a risky bet

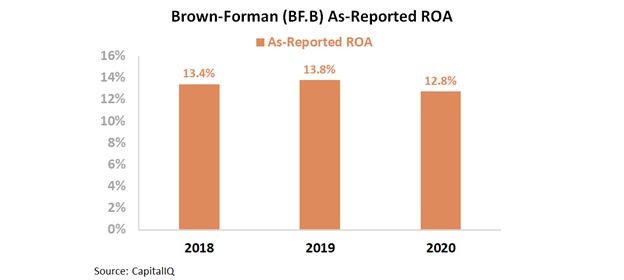
Today’s company is an alcohol firm poised to benefit from coronavirus tailwinds. However, looking at as-reported numbers, it appears the firm has relatively average returns.
UAFRS (Uniform) based analysis, on the other hand, shows the firm’s real performance, with the market and as-reported metrics missing the profitability of the firm.
Also below, Uniform Accounting Embedded Expectations Analysis and the Uniform Accounting Performance and Valuation Tearsheet for the company.
Investor Essentials Daily:
Tuesday Tearsheets
Powered by Valens Research
Alcohol, tobacco, and gambling companies are all grouped together as vice stocks by the investment community. This is because many investors choose not to invest in these names due to ethical concerns over their products.
In addition, vice stocks tend to behave similarly in specific macroeconomic conditions.
For example, vice stocks usually perform very well during recessions. When people are forced to deal with economic hardships, they often turn to alcohol and tobacco to cope. Furthermore, people increase gambling activity as some try to cure financial woes and hardships in one fell swoop.
However, during the current economic crisis, using old rules hasn’t always worked–we need to look at “sector splitting.” Activities that can be done at home are now performing better, while those done in the company of others are performing worse.
Sometimes, specific industries aren’t getting hit; it’s the companies within those industries that are or aren’t well positioned for the at-home revolution that win or lose.
Gambling has been hit hard, despite the fact this sector has performed historically well in recessions. Casinos are places full of human contact, either through chips, cards, or slot machines. As such, casinos closed across the country when the coronavirus pandemic began. While there has recently been a nascent recovery, casinos are still very far from normal operations.
On the other hand, demand for alcohol has surged since stay-at-home restrictions began. Unlike gambling, it is easy to consume alcohol at home. As such, many alcohol companies are benefiting from improving demand.
One company in particular is Brown-Forman (BF.B). The firm has a diverse alcohol portfolio, particularly Jack Daniel’s, as well as scotches, vodka, tequila, wine, and other liqueurs.
The market sees Brown-Forman as a consistent performer with slightly above average returns. The firm has sustained a return on assets (ROA) between 13% and 14% over the past three years.
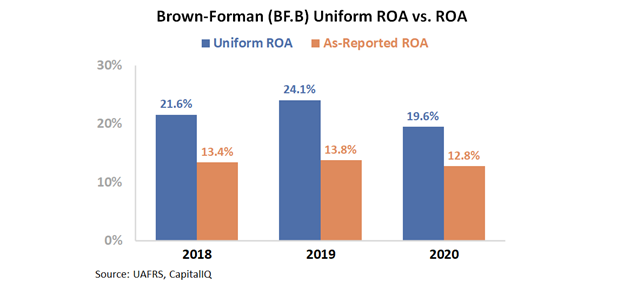
However, this depiction of the firm is not accurate. Brown-Forman’s profitability has been even more robust the last several years. Goodwill and intangibles, among other distortions, are artificially reducing the firm’s ROA. Uniform ROA has actually ranged between 20% and 24% over the past three years, well above as-reported levels.
That said, stock prices are driven by future expectations, not past performance. To understand valuations, we can use the Embedded Expectations Framework.
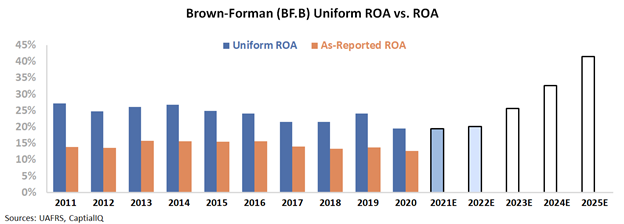
The chart below explains the company’s historical corporate performance levels, in terms of ROA (dark blue bars) versus what sell-side analysts think the company is going to do in the next two years (light blue bars) and what the market is pricing in at current valuations (white bars).
Given the economic environment, many companies are forecasted to have ROA fall this year. However, due to the nature of Brown-Forman, sell-side analysts forecast ROA to maintain current levels over the next two years. Normally, stagnating ROA is not seen as such a positive. Yet, in current times, sustaining returns is well above average.
However, the market is not expecting returns to fall or to stay flat going forward. It is expecting returns to improve to 40% by 2025. This is a considerable climb in profitability levels for the firm. Since 2005, Uniform ROA has never risen above 27%.
Not all vice stocks are performing as they usually do during this recession. However, alcohol companies are following historical trends and are seeing demand spike during this recession. The only issue is the market is pricing this to happen in perpetuity.
Clearly, the market is buying into the company due to its recession-proof model and consistent performance. However, Brown-Forman would need to revolutionize their business model to improve returns by such a wide margin. For equity holders, any possible upside might already be priced in.
Brown-Forman Corporation Embedded Expectations Analysis – Market expectations are for Uniform ROA to expand to all-time highs, but management may be concerned about the spirits industry, growth, and liquidity
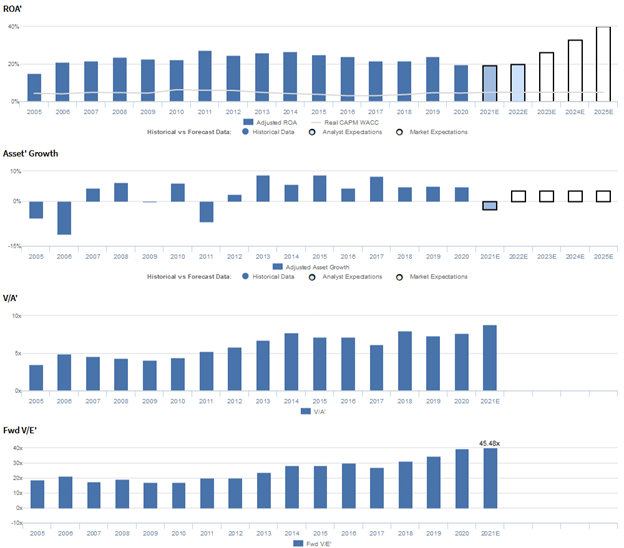
BF.B currently trades at a historical high relative to Uniform earnings, with a 45.5x Uniform P/E (Fwd V/E’). At these levels, the market is pricing in expectations for Uniform ROA to expand from 20% in 2020 to 40% by 2025, accompanied by 4% Uniform asset growth going forward
Meanwhile, analysts have less bullish expectations, projecting Uniform ROA to remain at 20% levels through 2022, accompanied by 3% Uniform asset shrinkage.
Historically, BF.B had seen robust and fairly stable profitability. Uniform ROA improved from a low of 15% in 2005 to a peak of 27% in 2011, before fading to 22% levels in 2017-2018 and jumping to 24% in 2019. Subsequently, Uniform ROA compressed to 20% in 2020.
Meanwhile, from 2005 to 2011, Uniform asset growth had been volatile, positive in only three of the seven years, while ranging from -11% to 6%. Since then, Uniform asset growth has been consistently positive, ranging from 2%-9% annually through 2020.
Performance Drivers – Sales, Margins, and Turns
General stability in Uniform ROA has been driven by offsetting trends in Uniform earnings margins and Uniform asset turns.
Uniform margins improved from 15% in 2005 to 21% in 2011, before briefly falling to 19% in 2012 and expanding to a peak of 28% in 2019. Since then, Uniform ROA compressed to 24% in 2020.
Meanwhile, after improving from 1.0x in 2005 to 1.4x in 2007, Uniform turns fell to 1.2x-1.3x levels from 2008-2014. Thereafter, Uniform turns further contracted to 0.8x-0.9x levels in 2017-2020.
At current valuations, markets appear to be pricing in expectations for Uniform margins to continue to expand to new peaks and for Uniform turns to reverse recent declines.
Earnings Call Forensics
Valens’ qualitative analysis of the firm’s Q4 2020 earnings call highlights that management may lack confidence in their ability to improve global travel retail growth, sustain current liquidity levels, and improve overall sales. Moreover, they may be exaggerating the health of the spirits industry in the U.S. and their position in the said industry, particularly Jack Daniel’s. They may also have concerns about the ability of their new brands to surpass big brands, the efficiency turnover of their Craft brands, and the performance of Fords Gin.
Furthermore, they may lack confidence in their ability to grow their business, develop a premium portfolio around the globe, and maintain consumers’ trust in their brands.
Management may also have concerns about the reduced consumption of their products, the continued net sales decline in their developed international markets, and the potential of consumer trade down in the next few years. In addition, they may be exaggerating the opportunities of their Nearest Green, Inc. partnership and the resiliency of the U.S. consumers.
They may also have concerns about effectively reprioritizing their portfolio, the debt capital markets’ conditions, and their rising credit risk. Finally, they may lack confidence in their ability to adapt to the changing business environment and continually challenge themselves as individuals, as leaders, and as teams.
UAFRS VS As-Reported
Uniform Accounting metrics also highlight a significantly different fundamental picture for BF.B than as-reported metrics reflect.
As-reported metrics can lead investors to view a company to be dramatically stronger or weaker than real operating fundamentals highlight. Understanding where these distortions occur can help explain why market expectations for the company may be divergent.
As-reported metrics significantly understate BF.B’s profitability. For example, as-reported ROA for BF.B was 13% in 2020, well below the Uniform ROA of 20%, making BF.B appear to be a much weaker business than real economic metrics highlight.
Moreover, since 2011, as-reported ROA has remained at 13%-16% levels through 2020, while Uniform ROA has declined from 27% to 20% over the same time frame, directionally distorting the market’s perception of the firm’s historical profitability for nearly a decade.
SUMMARY and Brown-Forman Corporation Tearsheet
As the Uniform Accounting tearsheet for Brown-Forman Corporation (BF.B:USA) highlights, its Uniform P/E trades at 45.5x, which is above corporate average valuation levels and its historical average valuations.
High P/Es require high EPS growth to sustain them. In the case of Brown-Forman, the company has recently shown a 13% Uniform EPS shrinkage.
Wall Street analysts provide stock and valuation recommendations that in general provide very poor guidance or insight. However, Wall Street analysts’ near-term earnings forecasts tend to have relevant information.
We take Wall Street forecasts for GAAP earnings and convert them to Uniform earnings forecasts. When we do this, Brown-Forman’s Wall Street analyst-driven forecast an EPS shrinkage of 2% in 2021, followed by a 9% EPS growth in 2022.
Based on the current stock market valuations, we can use earnings growth valuation metrics to back into the required growth rate to justify Brown-Forman’s $80 stock price. These are often referred to as market embedded expectations.
The company needs to have Uniform earnings grow by 18% each year over the next three years to justify current prices. What Wall Street analysts expect for Brown-Forman’s earnings growth is below what the current stock market valuation requires in 2021 and 2022.
Furthermore, the company’s earning power is 3x the corporate average. Also, cash flows are 3x higher than its total obligations—including debt maturities, capex maintenance, and dividends. Together, this signals low credit and dividend risk.
To conclude, Brown-Forman’s Uniform earnings growth is above peer averages. Therefore, as is warranted, it is also trading above average peer valuations.
Best regards,
Joel Litman & Rob Spivey
Chief Investment Strategist &
Director of Research
at Valens Research


