
This billionaire fund manager is pumped up for winning both in baseball and investments

There are lots of wealthy, or highly successful people in the world of the investment industry. But it’s extremely difficult to find someone else so iconic as Steve A. Cohen.
Being a baseball team owner and being one of the world’s best fund managers does not come easily.
He has made the headlines recently in sports media with a huge payroll for his team that reaches almost half a billion dollars with taxes.
Let’s have a look at him from a different angle to check if his fund, Point72 Asset Management, is as well-positioned as his team.
In addition to examining the portfolio, we’re including a deeper look into the fund’s largest current holding, providing you with the current Uniform Accounting Performance and Valuation Tearsheet for that company.
Also below, a detailed Uniform Accounting tearsheet of the fund’s largest holding.
Investor Essentials Daily:
Friday Uniform Portfolio Analytics
Powered by Valens Research
Steve Cohen is surely one of the most controversial and iconic personalities in the world of finance and investment management.
His life even inspired the main character of the series called “Billions”.
He also made the news recently about his spending on his baseball team, New York Mets.
The team’s payroll is already $100 million more than where the closest competitor Yankees are.
He is willing to spend way more than anyone else to build a dominant baseball team. But he’s not willing to spend at no concern, he cares about getting the right deal.
The negotiation with Correa could be a great example that he won’t jump with the medical issues but is willing to make a good deal.
That’s not unlike how he runs his firm too.
He’s always been known to pay the top dollar for information or analysts that can help him beat the market, but he’s ruthless with risk controls.
Due to his strict views on risk management, his ex-fund SAC Capital returned around 70% during the dot-com boom and didn’t even see a single down year until the 2008 recession.
That was a huge success for that time period.
But today is much different than in the 90s and 2000s. Additionally, he has other responsibilities that could distract him in these difficult market conditions.
Since he takes one of the highest management fees in the industry, investors are concerned that his focus on other things could negatively affect the performance of the fund.
In light of this context, let’s see the fund using Uniform Accounting and evaluate if he’s primed to win with Point72 as well as if he’s primed to win with the Mets in 2023.
Economic productivity is massively misunderstood on Wall Street. This is reflected by the 130+ distortions in the Generally Accepted Accounting Principles (GAAP) that make as-reported results poor representations of real economic productivity.
These distortions include the poor capitalization of R&D, the use of goodwill and intangibles to inflate a company’s asset base, a poor understanding of one-off expense line items, as well as flawed acquisition accounting.
It’s no surprise that once many of these distortions are accounted for, it becomes apparent which companies are in real robust profitability and which may not be as strong of an investment.
See for yourself below.
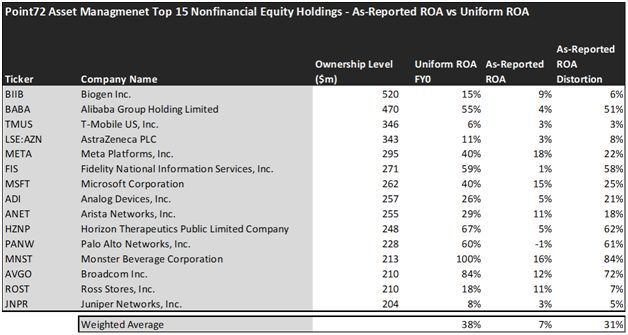
Looking at as-reported accounting numbers, investors would think that investing in Point72 Asset Management is not really rewarding.
On an as-reported basis, many of the companies in the fund are poor performers. The average as-reported ROA for the top 15 holdings of the fund is 7%, which is below the U.S. corporate average of 12%.
However, once we make Uniform Accounting adjustments to accurately calculate the earning power, we can see that the average return in Point72 Asset Management’s top 15 holdings is actually 38%.
As the distortions from as-reported accounting are removed, we can see Broadcom (AVGO) that isn’t a 12% return business. Its Uniform ROA is 84%.
Meanwhile, Monster Beverage Corporation (MNST) looks like a 16% return business, but this massive energy drinks company actually powers a 100% Uniform ROA.
To find companies that can deliver alpha beyond the market, just finding companies where as-reported metrics misrepresent a company’s real profitability is insufficient.
To really generate alpha, any investor also needs to identify where the market is significantly undervaluing the company’s potential.
These dislocations demonstrate that most of these firms are in a different financial position than GAAP may make their books appear. But there is another crucial step in the search for alpha. Investors need to also find companies that are performing better than their valuations imply.
Valens has built a systematic process called Embedded Expectations Analysis to help investors get a sense of the future performance already baked into a company’s current stock price. Take a look:
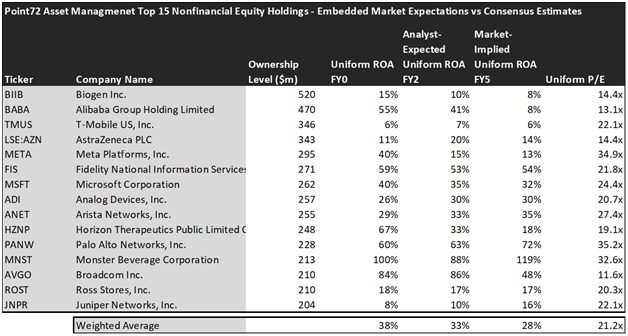
This chart shows four interesting data points:
- The average Uniform ROA among Point72 Asset Management’s top 15 holdings is actually 38% which is much better than the corporate average in the United States.
- The analyst-expected Uniform ROA represents what ROA is forecasted to do over the next two years. To get the ROA value, we take consensus Wall Street estimates and convert them to the Uniform Accounting framework.
- The market-implied Uniform ROA is what the market thinks Uniform ROA is going to be in the three years following the analyst expectations, which for most companies here are 2023, 2024, and 2025. Here, we show the sort of economic productivity a company needs to achieve to justify its current stock price.
- The Uniform P/E is our measure of how expensive a company is relative to its Uniform earnings. For reference, the average Uniform P/E across the investing universe is roughly 20x.
Embedded Expectations Analysis of Point72 Asset Management paints a clear picture. Over the next few years, Wall Street analysts expect the companies in the fund to decline in profitability and the market agrees with analysts, but it is slightly more pessimistic.
Analysts forecast the portfolio holdings on average to see Uniform ROA fall to 33% over the next two years. At current valuations, the market agrees with the analysts and expects a 28% Uniform ROA for the companies in the portfolio.
For instance, Microsoft (MSFT) returned 40% this year. Analysts think its returns will drop to 35%. And at a 24.4x Uniform P/E, the market expects a deeper decline in profitability and is pricing Uniform ROA to be around 32%.
Similarly, Biogen’s (BIIB) Uniform ROA is 15%. Analysts expect its returns to fall to 10% and the market is pricing its returns to decline to 8%.
Overall, Point72 Asset Management has a balanced portfolio that is composed of high-quality companies that can provide resilience and high-growth names that can deliver high returns. However, investors should be aware of the risks and should do a deep fundamental and valuation analysis before investing.
This just goes to show the importance of valuation in the investing process. Finding a company with strong profitability and growth is only half of the process. The other, just as important part, is attaching reasonable valuations to the companies and understanding which have upside which has not been fully priced into their current prices.
To see a list of companies that have great performance and stability also at attractive valuations, the Valens Conviction Long Idea List is the place to look. The conviction list is powered by the Valens database, which offers access to full Uniform Accounting metrics for thousands of companies.
Click here to get access.
Read on to see a detailed tearsheet of one of Point72 Asset Management’s largest holdings.
SUMMARY and Biogen Inc. Tearsheet
As one of Point72 Asset Management’s largest individual stock holdings, we’re highlighting Biogen Inc.’s (BIIB:USA) tearsheet today.
As the Uniform Accounting tearsheet for Biogen Inc. highlights, its Uniform P/E trades at 14.4x, which is below the global corporate average of 18.4x, and around its historical average of 12.7x.
Low P/Es require low EPS growth to sustain them. That said, in the case of Biogen Inc., the company has recently shown 37% Uniform EPS shrinkage.
Wall Street analysts provide stock and valuation recommendations that, in general, provide very poor guidance or insight. However, Wall Street analysts’ near-term earnings forecasts tend to have relevant information.
We take Wall Street forecasts for GAAP earnings and convert them to Uniform earnings forecasts. When we do this, Biogen Inc.’s Wall Street analyst-driven forecast is for EPS to grow by 2% in 2022 and shrink by 31% in 2023.
Furthermore, the company’s return on assets was 15% in 2021, which is 2x the long-run corporate averages. Also, cash flows and cash on hand consistently exceed its total obligations—including debt maturities and CAPEX maintenance. Moreover, its intrinsic credit risk is 50bps above the risk-free rate. Together, these signal low operating risks and low credit risks.
Lastly, Biogen Inc.’s Uniform earnings growth is below peer averages, and in line with peer valuations.
Best regards,
Joel Litman & Rob Spivey
Chief Investment Strategist &
Director of Research
at Valens Research


