
BlackRock’s passive ETFs are minting money, despite what the as-reported numbers suggest

No investor enjoys overpaying for a stock, especially if it underperforms relative to their expectations.
The same is true for professionally managed investment funds. With high fees and questionable performance, many have fled from underwhelming portfolio managers.
The dramatic rise of ETFs and index funds over the past decade has shown that investors of all stripes are putting their money behind low-cost passive strategies instead.
Today, we’ll highlight one name that dominates the passive investing space and, despite what as-reported metrics might suggest, is a profit-making powerhouse.
Also below, the company’s Uniform Accounting Performance and Valuation Tearsheet.
Investor Essentials Daily:
Thursday Tearsheets
Powered by Valens Research
Investors constantly take different sides of an investment thesis or trade idea.
Sophisticated hedge funds may differ in their currency bets. One fund might short the euro and go long the dollar. Another might do the opposite.
Similarly, retail investors may differ on their favorite stocks. Some might buy Tesla (TSLA) or Apple (AAPL) while others might avoid such high-profile names.
Despite all of these differences, there is one thing almost everyone in the investing world agrees on: disdain for outsized management fees.
Investors, no matter how big or small, don’t like paying excess fees that eat into their returns over long periods of time.
That’s partly why we’ve seen such a revolution in the world of exchange-traded funds (ETFs) and passive investing over the past decade.
ETFs that passively track an index like the S&P 500 have continuously dominated investor fund flows versus actively managed products.
Part of the reason is that a consensus has been built around how incredibly difficult it is for investors to beat the market.
This is no surprise given that many actively managed strategies have underperformed the markets for long periods of time.
But in addition to outperformance, the other component passive ETFs have going for them is that they charge significantly lower management fees.
This means more returns end up in investors’ pockets rather than in those of portfolio managers—music to investors’ ears.
One might assume that the shift to lower fees has translated into lower profitability for giant fund managers like BlackRock (BLK) who specialize in providing these products.
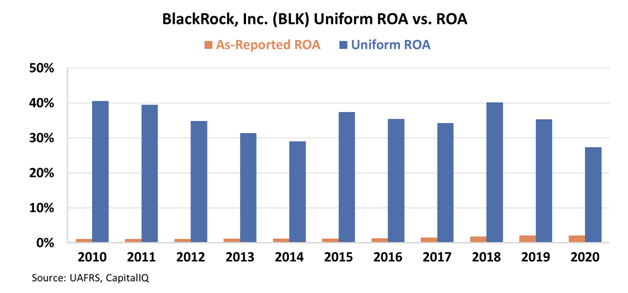
A look at as-reported metrics appears to confirm this view. The company’s as-reported return on assets (“ROA”) has consistently hovered around 1%-2% over the past decade.
That is well below average cost-of-capital levels, which are around 4.8% in the U.S. In other words, as-reported metrics suggest the world’s largest asset manager is essentially a wealth destroyer.

In reality, Uniform Accounting allows us to see that BlackRock hasn’t become so massive by acting like a charity.
The company has shown itself to be incredibly profitable by running its passive strategies at scale—it has $10 trillion in assets under management (“AUM”)—and spreading out costs.
This is evidenced by BlackRock’s Uniform ROA being consistently above 25% over the past 10 years, well above what as-reported metrics suggest.
There appears to be nothing that can stop the massive trend towards low-cost passive investing.
As BlackRock continues to benefit and see its AUM expand, Uniform Accounting highlights how the company can continue to focus on its money-minting strategy.
SUMMARY and BlackRock Tearsheet
As the Uniform Accounting tearsheet for BlackRock, Inc. (BLK:USA) highlights, the Uniform P/E trades at 40.4x, which is above the global corporate average of 24.0x and its own historical P/E of 30.3x.
High P/Es require high EPS growth to sustain them. In the case of BlackRock, the company has recently shown a 3% Uniform EPS growth.
Wall Street analysts provide stock and valuation recommendations that in general provide very poor guidance or insight. However, Wall Street analysts’ near-term earnings forecasts tend to have relevant information.
We take Wall Street forecasts for GAAP earnings and convert them to Uniform earnings forecasts. When we do this, BlackRock’s Wall Street analyst-driven forecast is 27% and 6% EPS growth in 2021 and 2022, respectively.
Based on the current stock market valuations, we can use earnings growth valuation metrics to back into the required growth rate to justify BlackRock’s $919 stock price. These are often referred to as market embedded expectations.
The company is currently being valued as if Uniform earnings were to grow by 22% annually over the next three years. What Wall Street analysts expect for BlackRock’s earnings growth is above what the current stock market valuation requires in 2021, but below this requirement in 2022.
Furthermore, the company’s earning power in 2020 is 5x the long-run corporate average. Moreover, cash flows and cash on hand are 3x its total obligations, and intrinsic credit risk is 20bps above risk-free rate, signaling low dividend risk.
Lastly, BlackRock’s Uniform earnings growth is above peer averages, while the company is also trading above its average peer valuations.
Best regards,
Joel Litman & Rob Spivey
Chief Investment Strategist &
Director of Research
at Valens Research


