
This company is set to thrive off of disrupted food habits, despite what as-reported metrics say

This food conglomerate has diversified its portfolio and set itself up for success during the “At-Home Revolution.”
As-reported metrics would have you believe this company has returns only slightly above cost-of-capital. True UAFRS (Uniform) based analysis shows the firm’s real profitability.
Also below, Uniform Accounting Embedded Expectations Analysis and the Uniform Accounting Performance and Valuation Tearsheet for the company.
Investor Essentials Daily:
Tuesday Tearsheets
Powered by Valens Research
As we have touched on before, the “At-Home Revolution” has changed many aspects of everyday life and has affected every industry. One industry especially altered by this radical change is food. Not all food companies have been affected the same way though. Some companies have emerged as winners, and some have been impacted severely.
For example, sit-down restaurants have been adversely affected. Due to coronavirus restrictions, many of these establishments were forced to temporarily shut down or face total closings. That led to firms that supply premium restaurants to have serious issues.
On the other hand, companies that sell their branded food to grocery stores–essential foods–have benefitted. These companies have seen increased demand as people have been unable to eat out.
Prior to coronavirus, people regularly ate out. About 60% of Americans went out for dinner at least once a week, and many adults and children ate lunch at work or at school. This routine has completely changed.
People do still have the option to order in food, but now, much more food needs to be eaten and prepared at home.
This has caused families and adults to alter their food buying habits. Parents now have to buy more food for their children instead of relying on school lunches. Adults need to buy more meals and snacks for themselves, too, since they spend more time at home.
One company that benefits from both of these trends is Conagra Brands (CAG). Conagra has a large portfolio of food brands. Its Slimjim and Orville Redenbacher’s brands make it easy to snack, while brands like Chef Boyardee, Banquet, and Marie Callender’s make meals extremely easy to make.
Overall, Conagra is making life easier for many families in quarantine. However, many investors think this might be a short-lived tailwind. They also believe it just means higher growth for a low-return business, which wouldn’t really move the needle on returns.
As-reported Return on assets (ROA) have been low for years, stuck below 8%.

However, as-reported accounting inaccuracies are distorting Conagra’s real performance.
The reality is, Conagra is actually a high-returns business. Misrepresentation of goodwill and intangibles has distorted the firm’s asset base, alongside other required adjustments. In fact, Conagra’s Uniform ROA has been growing steadily now for years, more than doubling from 10% in 2015 to 28% in 2020.

This growth has been supported by strategic acquisitions in recent years. Specifically, its acquisition of Pinnacle Foods in 2018 that allowed the firm to add frozen vegetables, Celeste pizzas, and vegetarian options to its portfolio. This has diversified its product offerings, increased its available market, and has set the company up for further growth.
The risk with Conagra is not that Conagra has low returns; it is that the market is pricing in continued growth over the following years. Embedded Expectations analysis shows the market expects the company to reach a 35% Uniform ROA by 2024.
Given recent trends, Conagra is in a position to sustain its recent growth, yet those are extraordinary high expectations. Even if Conagra can execute, it’s only fairly valued in that scenario.
With high returns and a macro catalyst for growth, Conagra is exactly the kind of company to pay attention to right now.
Conagra Brands, Inc. Embedded Expectations Analysis – Market expectations are for Uniform ROA to expand to new highs, but management appears concerned about growth, international operations, and margins
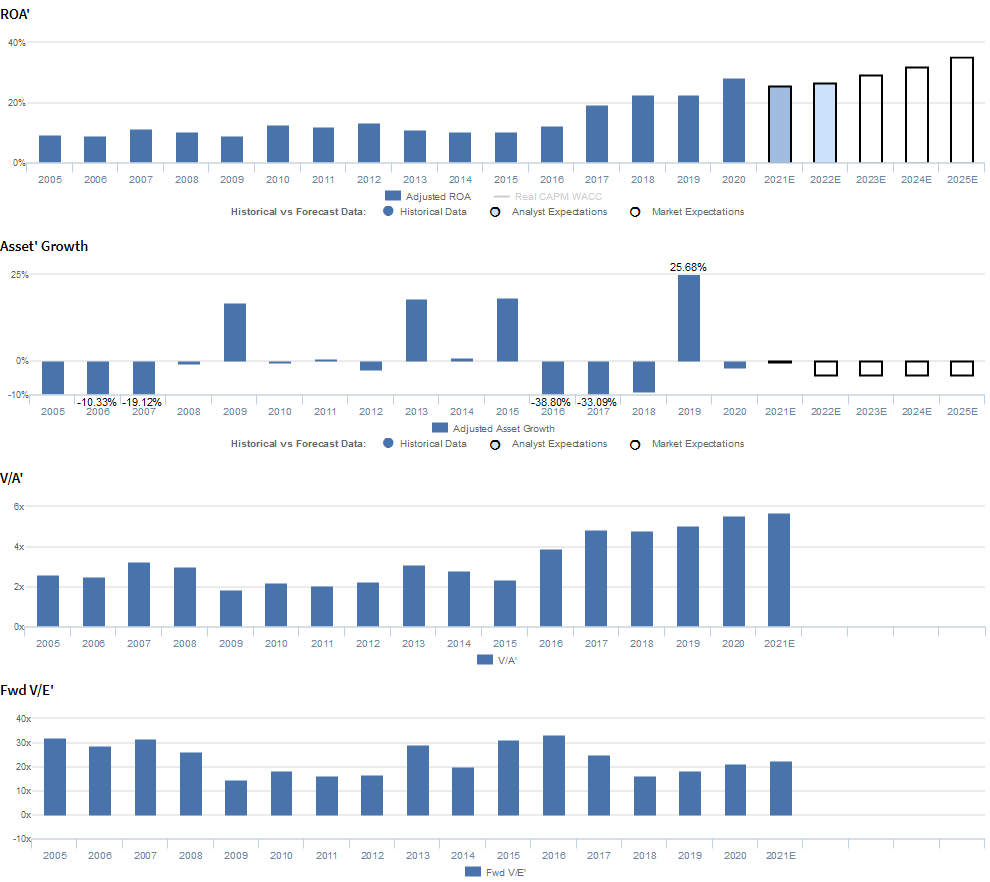
CAG currently trades near corporate averages relative to Uniform earnings with a 22.3x Uniform P/E (Fwd V/E′). At these levels, the market is pricing in expectations for Uniform ROA to expand from 28% in 2020 to 35% in 2025, accompanied by 4% Uniform asset shrinkage.
However, analysts have less bullish expectations, projecting Uniform ROA to remain at 27%-28% levels in 2022, accompanied by immaterial Uniform asset growth.
Historically, CAG has seen generally improving profitability. After improving from 9% in 2005 to 11% in 2007, Uniform ROA faded back to 9% in 2009 and subsequently recovered to 13% in 2010.
Thereafter, Uniform ROA maintained 10%-13% levels through 2016, before expanding to a peak of 28% in 2020.
Meanwhile, Uniform asset growth has been volatile, positive in only six of the past sixteen years, while ranging from -39% to 26%, with the former driven by the spin-off of Lamb Weston in 2016 and the latter due to the acquisition of Pinnacle Foods in 2019.
Performance Drivers – Sales, Margins, and Turns
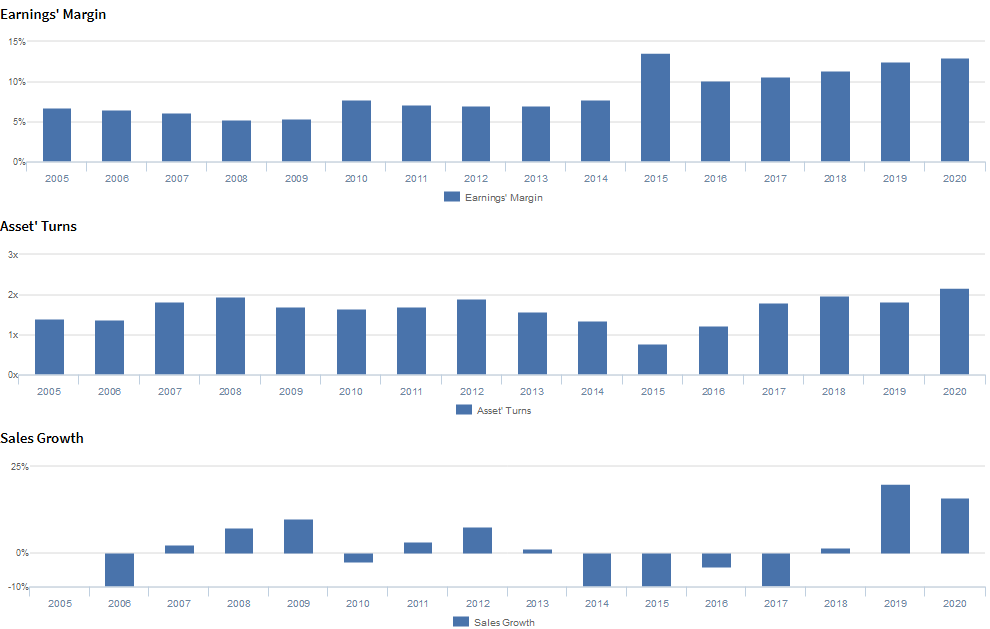
Overall improvements in Uniform ROA have been driven primarily by improving Uniform earnings margins and only recently, improving Uniform asset turns.
After sustaining 5%-8% levels from 2005 through 2014, Uniform margins jumped to a peak of 14% in 2015. Then, Uniform margins dropped to 10% in 2016, before recovering to 13% in 2019.
Meanwhile, after improving from 1.4x levels in 2005-2006 to 1.9x in 2008, Uniform turns stabilized at 1.7x-1.9x levels through 2012, before compressing to a low of 0.8x in 2015.
Thereafter, Uniform turns rose to a peak of 2.2x in 2020. At current valuations, the market is pricing in expectations for both Uniform margins and Uniform turns to reach new peaks.
Earnings Call Forensics
Valens’ qualitative analysis of the firm’s Q4 2020 earnings call highlights that management generated an excitement marker when saying in addition to the strength of their trial and repeat results on an absolute basis, they are outperforming peers in terms of their new trial.
Additionally, they are confident SG&A expenses are growing slower than net sales, and that their recent unsecured term loan will allow them to refinance upcoming debt maturities.
However, they may lack confidence in their ability to sustain recent growth in their staples business, and they may have concerns about their ability to incorporate modern attributes into their food.
Furthermore, they may be concerned about the sustainability of recent same customer sales, and may lack confidence in their ability to invest in long-term value creation. Moreover, they may be concerned about their inventory management, foreign exchange headwinds and international growth, and their ability to roll out new products.
Additionally, management may be concerned about their ability to provide long-term guidance by the end of the fiscal year, and they may be exaggerating the current momentum they are seeing in the market.
They may also be concerned about their ability to reach synergy targets and sustain their operating margin, and about the sustainability of increased demand for frozen foods from millennials and generation Z. Finally, they may be downplaying concerns about promotional pricing.
UAFRS VS As-Reported
Uniform Accounting metrics also highlight a significantly different fundamental picture for CAG than as-reported metrics reflect.
As-reported metrics can lead investors to view a company to be dramatically stronger or weaker than real operating fundamentals highlight.
Understanding where these distortions occur can help explain why market expectations for the company may be divergent.
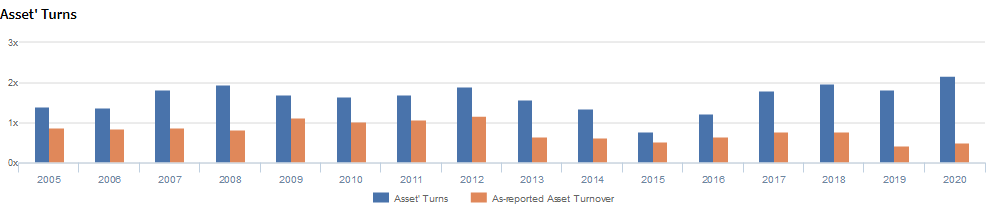
As-reported metrics significantly understate CAG’s asset utilization, one of the key drivers of profitability.
For example, as-reported asset turnover for CAG was 0.5x in 2020, substantially lower than Uniform asset turns of 2.2x, making CAG appear to be a less efficient business than is accurate.
Moreover, since 2015, as-reported asset turnover has remained at 0.5x in 2020, while Uniform turns have expanded from 0.8x to 2.2x over the same timeframe, directionally distorting the market’s perception of the firm’s recent asset efficiency trends.
SUMMARY and Conagra Brands, Inc. Tearsheet
As the Uniform Accounting tearsheet for Conagra Brands, Inc. (CAG:USA) highlights, the Uniform P/E trades at 22.3x, which is around corporate average valuation levels but above its historical averages.
Average P/Es require average EPS growth to sustain them. In the case of Conagra, the company has recently shown a 7% Uniform EPS growth.
Wall Street analysts provide stock and valuation recommendations that in general provide very poor guidance or insight. However, Wall Street analysts’ near-term earnings forecasts tend to have relevant information.
We take Wall Street forecasts for GAAP earnings and convert them to Uniform earnings forecasts. When we do this, Conagra’s Wall Street analyst-driven forecast is a 12% shrinkage in 2020 and 7% EPS growth in 2021.
Based on the current stock market valuations, we can use earnings growth valuation metrics to back into the required growth rate to justify Conagra’s $38 stock price. These are often referred to as market embedded expectations.
The company can have Uniform earnings shrink by 1% each year over the next three years and still justify current prices. What Wall Street analysts expect for Conagra’s earnings growth is far above what the current stock market valuation requires in 2021.
Furthermore, the company’s earning power is 5x the corporate average. However, the company’s cash flows and cash on hand will consistently fall short of debt headwalls over the next five years. Together, this signals high credit and dividend risk.
To conclude, Conagra’s Uniform earnings growth is trading below peer averages, therefore, the company is also trading below average peer valuations.
Best regards,
Joel Litman & Rob Spivey
Chief Investment Strategist &
Director of Research
at Valens Research