
Capacity Utilization is a key metric to measure economic health—normally, current low levels would imply a long slog, not this time though

Over the past 30 years, total capacity utilization has been a vital metric in gauging economic health.
During the 2020 pandemic, the total capacity utilization for the US economy has fallen to new lows. However, the headwinds to capacity utilization during quarantine are different than previous recessions.
It is critical to look at capacity utilization not in isolation, but with other metrics to provide context to the current reduction in productivity. Due to historically low PP&E levels, a future recovery will be impacted by the unique conditions of this recession.
Investor Essentials Daily:
The Monday Macro Report
Powered by Valens Research
As regular readers of the Investor Essentials Daily know, Monday is the day we highlight macroeconomic trends we identify during our market phase cycle analysis. A metric we use often to gauge overall economic health is capacity utilization.
This is a measure of how much of the total infrastructure of an economy is currently in use. The Fed uses this metric to understand inflationary pressures as well as the severity of market downturns.
As you can imagine, this number has changed significantly with the pandemic. This is why it’s important to revisit this key metric compared to 2019 levels.
Over the last four months, restaurants have been looking for ways to open. Travel companies are unable to make bookings. Brick-and-mortar stores have been forced to limit the capacity of shoppers. Factories across the country have been forced to close as they cannot meet social distancing guidelines.
All of this has brought down the capacity utilization of the United States massively, and at a historic rate.
When measuring capacity utilization, historically a value above 85% means corporations need significant investment to grow, which can cause inflation. Large dips in capacity utilization are a lagging indicator of a recession. They signal capex will likely be subdued going forward, and are also a signal of lower inflation going forward, due to slack in the economy.
As you can see, US total capacity utilization fell dramatically in 2001 and 2008, during periods of economic contraction. Critically, capacity utilization in the United States has reached 30-year lows in 2020, falling just below 65%.
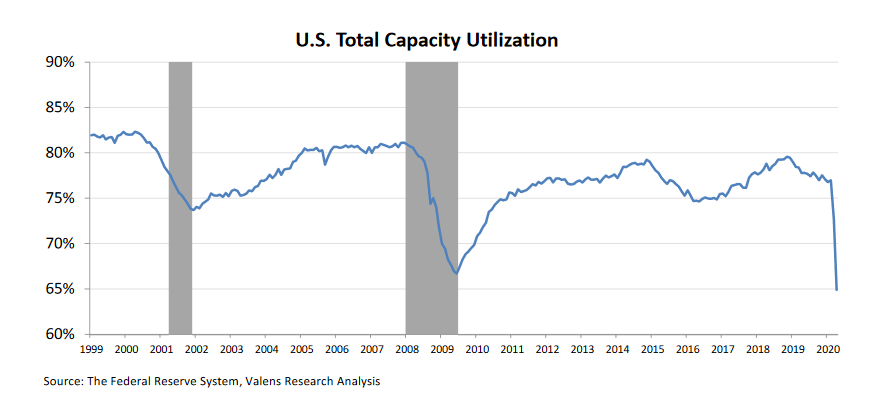
While not a surprising drop, this massive decline is a powerful visualization for how much the economy has contracted over the past quarter.
Capacity utilization also functions as a powerful indicator of future economic growth due to its compounding nature. As utilization retracts, spending falls and puts further pressure on the economy, creating a vicious cycle of deflation and job loss.
Even after the economy starts to recover, there is so much slack in the system that corporations don’t need to rush to invest in capex. That means recoveries can be slow slogs with the virtuous cycle of capex spending begetting more capex spending being postponed until the economy really starts to heat up.
However, this contraction is different from other dips in capacity utilization over the past 30+ years. Total capacity utilization has been pressured due to social distancing measures, which can be lifted after the quarantine, not due to structural problems in the wider economy.
This means that as the quarantine restrictions are eased, capacity utilization could rebound aggressively, far faster than it normally does, assuming there aren’t other follow-on issues.
Furthermore, if capacity utilization does see a resurgence, the vicious cycle mentioned above can turn into a new virtuous cycle in a way that is unique to this recovery. This also translates to a stronger recovery in capex.
The chart below measures the age of business assets in the US, such as factories and machinery. A lower ratio, meaning those assets are more depreciated, means that assets are older.
When assets get older, they’re more likely to break down, to be able to handle lower production rates, and other issues. Basically they are more likely to need to be replaced sooner.
As you can see, the Net to Gross Property, Plant, and Equipment (PP&E) is currently the lowest it has been in the past 20 years.

Normally entering a recession, as you can see from the 2001 level at the far left, and the bubble in 2007, Net to Gross PP&E levels are at their peaks. This is because recessions normally happen after a glut of debt and over-excitement about growth opportunities leads to significant capex spend and a subsequent hangover of companies with bad financial positions and credit defaults and destruction.
This chart shows that this time around, things are very different.
With such highly depreciated assets, if capacity rebounds, firms will need to invest in new PP&E to service renewed demand, they won’t be able to just use up slack capacity.
That means spending could surge higher faster than expected, and could sustain through the next few years as capacity utilization recovers to more normal elevated levels. Firms will be looking to build their PP&E back up to historical averages.
Normally a recession follows a capex surge, meaning PP&E spending can remain subdued through a recovery. This time though, there will likely need to be PP&E spending that will help fuel a recovery once things start back up, and that is bullish once things start to accelerate.
It is important to understand how different metrics have been flipped on their head during 2020, due to unique factors causing this recession. By only looking at one metric in isolation, the story can be lost due to the lack of context.
Traditionally, exceptionally low total capacity utilization is a telltale sign the U.S. has entered a deep and likely long lasting recession, much like in 2008.
And yet, the distinct factors to this pandemic-driven recession and the historical low levels of investment mean once a recovery is underway, it could be faster and stronger, amplified by capex spending needs than previous recessions.
Best regards,
Joel Litman & Rob Spivey
Chief Investment Strategist &
Director of Research
at Valens Research