
Cathie Wood’s funds have gained a cult following for good reason

U.S. corporations are getting more profitable by the year. Ignoring the last two recessions, corporate America is in a secular uptrend.
Innovation – from technological advances to brand new corporate structures – is the driving force transforming the U.S. from an industrial powerhouse to a leader in the fourth industrial revolution.
Today’s fund, Ark Innovation, has quickly gained attention for its stellar performance in 2020.
In addition to examining the portfolio, we’re including a deeper look into the fund’s largest current holding, providing you with the current Uniform Accounting Performance and Valuation Tearsheet for that company.
Investor Essentials Daily:
Friday Uniform Portfolio Analytics
Powered by Valens Research
Over the past year or so, we have regularly talked about how the U.S. corporate average returns on assets (ROA) have been in a secular improvement for 20+ years. We last talked about aggregate ROA in our October 26 Investor Essentials Daily, and it’s been a frequent topic in our monthly Market Phase Cycle report.
This long-term expansion has a number of drivers. For starters, we’ve seen a massive uptick in the number of skilled activist investors and consultants guiding management teams towards more sustainable capital deployment strategies.
Teams are learning to invest only when the returns justify the investments, eliminating unproductive growth.
Gone are the days of management teams chasing growth without risk or consequences. This slow and steady approach has driven stable ROA expansion for nearly the entire 21st century.
At the same time, the same consultants and activist investors have been pushing management to reduce costs. There are all kinds of cost management techniques, six sigma, lean manufacturing, strict working capital management, which help boost efficiency and margins.
There’s an even more important factor though, companies can only improve their growth strategies and efficiency metrics so much before there are no more improvements to be made.
Simultaneously, the U.S. has quietly transformed from a manufacturing hub to an innovation hub.
With this transition, the U.S. has become dependent on developing and profiting from intellectual property (IP) as opposed to asset-intensive manufacturing processes.
There’s a reason the knowledge economy is a popular concept these days. It’s far more profitable than manufacturing.
Designing products and developing intellectual property require far fewer assets than does manufacturing, and IP is often harder to recreate.
While smart growth and diligent cost management are important, innovation has driven the last two decades of American earning power.
Cathie Wood, founder of ARK Investment Management, has made it her mission to invest in disruptive and innovative companies for this exact reason.
While all of ARK’s actively managed ETFs are focused on innovation to some extent, one fund in particular, aptly named the Innovation ETF, has identified innovation as a key value driver in the markets.
Since the March lows last year, ARK Innovation (ARKK) has become the poster child for innovation, investing in companies like Tesla (TSLA), Roku (ROKU), and Square (SQ).
Using as-reported metrics, the firms in the ARK Innovation Trust mostly look like sub-par, underperforming businesses.
As-reported GAAP accounting unfairly punishes innovation because of several outdated accounting principles, including the unintuitive treatment of R&D as an expense.
In reality, by looking at the Uniform metrics, we can see what Cathie Wood sees when she’s managing ARK Innovation.
We’ve conducted a portfolio audit of ARK Innovation’s top equity holdings, based on its most recent 13-F, focusing on their non-financial company holdings.
Uniform Accounting metrics highlight the company’s equity investments are much higher quality, and have higher potential, than the market and as-reported metrics imply.
See for yourself below.
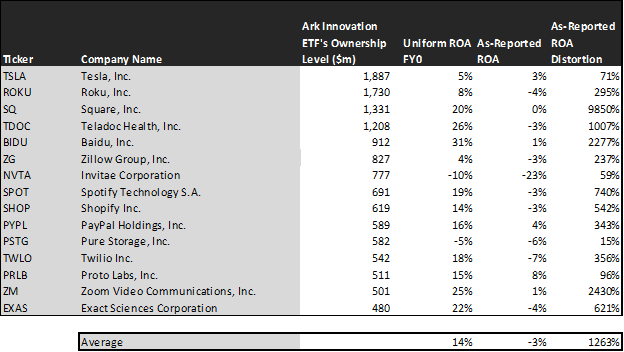
Using as-reported accounting, investors might think ARK Innovation Trust is buying names with low profitability levels. In reality, the firm sees through the accounting noise to pick up names markets are completely misunderstanding, often because of accounting issues.
On an as-reported basis, many of these companies are poor performers with negative returns. The portfolio has an average as-reported ROA of -3%.
However, once we make Uniform Accounting (UAFRS) adjustments to accurately calculate earning power, we can see that the returns of the companies in ARK Innovation’s portfolio are much more robust.
The average company in the portfolio displays an average Uniform return on assets (ROA) at 14%.
Once the distortions from as-reported accounting are removed, we can realize that Exact Sciences (EXAS) doesn’t have an ROA of -4%, but returns of 22%. Exact Sciences isn’t a low-return distressed company, it is a company with robust cash flows that ARK Innovation thinks is misunderstood by equity investors.
Similarly, Teladoc Health’s (TDOC) ROA is really 26%, not -3%. ARK Innovation’s focus on better accounting recognizes a high return business with cash flows to handle obligations.
Baidu (BIDU) ROA isn’t 1%, it’s actually 31%. Uniform Accounting lines up with ARK Innovation’s decision making, Square is really a high return business with ability to service its credit obligations.
The list goes on from there, for names ranging from Spotify Technologies (SPOT) and Twilio (TWLO), to Square (SQ) and Zoom Technologies (ZM).
We recently reviewed ARK Innovation’s portfolio in more detail using our Altimeter stock grading tool. The tool allows us to quickly screen ARK Innovation based on performance quality and valuations to assign grades, “A” through “F,” on its top holdings.
If you’d like to see more detailed insights on the ARK Innovation portfolio and have access to our grades for over 4,000 companies, you can click here to learn more about the Altimeter and use the tool for a week.
If ARK Innovation’s investment strategy was powered by as-reported metrics, it would never pick most of these companies, because they look like bad companies and poor investments.
To find companies that can deliver alpha beyond the market, just finding companies where as-reported metrics mis-represent a company’s real profitability is insufficient.
To really generate alpha, any investor also needs to identify where the market is significantly undervaluing the company’s potential.
ARK Innovation is also investing in companies that the market has low expectations for, low expectations the companies can exceed.

This chart shows three interesting data points:
- The 2-year Uniform EPS growth represents what Uniform earnings growth is forecast to be over the next two years. The EPS number used is the value of when we take consensus Wall Street estimates and we convert them to the Uniform Accounting framework.
- The market expected Uniform EPS growth is what the market thinks Uniform earnings growth is going to be for the next two years. Here, we show by how much the company needs to grow Uniform earnings in the next 2 years to justify the current stock price of the company. If you’ve been reading our daily analyses and reports for a while, you’ll be familiar with the term embedded expectations. This is the market’s embedded expectations for Uniform earnings growth.
- The Uniform EPS growth spread is the spread between how much the company’s Uniform earnings could grow if the Uniform earnings estimates are right, and what the market expects Uniform earnings growth to be.
The average company in the U.S. is forecast to have 5% annual Uniform Accounting earnings growth over the next 2 years. Ark Innovation’s holdings are forecast by analysts to grow by 51%, well above average.
This is more than 5x the growth the market is currently pricing in. The market expects earnings to grow by 8% for the next two years.
One example of a company in the ARK Innovation portfolio that has growth potential that the market is mispricing is Pure Storage (PSTG). Pure Storage’s analyst forecasts have 17% Uniform earnings growth built in, but the market is pricing the company to have earnings shrink by 3% each year for the next two years.
Baidu (BIDU) also has massive dislocations. The market expects Baidu’s earnings to shrink by 21% over the next two years, while analysts project earnings to grow by 6%.
These types of directional distortions indicate the market may think innovation isn’t worth a premium, or that companies like Baidu aren’t as innovative as they really are.
Yet another is the fund’s largest holding. Tesla (TSLA) is priced for a 42% growth by the market, when they are really forecasted to grow by earnings by 174% a year.
For the most part, ARK Innovation’s holdings are high quality, undervalued companies with businesses displaying strong earning power. This wouldn’t be clear under GAAP, but unsurprisingly Uniform Accounting and a system built to deliver alpha see the same signals.
SUMMARY and Tesla, Inc. Tearsheet
As Ark Innovation ETF’s largest individual stock holding, we’re highlighting the tearsheet of Tesla, Inc. (TSLA:USA) today.
As the Uniform Accounting tearsheet for Tesla highlights, the Uniform P/E trades at 179.6x, which is above the global corporate average of 25.2x and its historical P/E of 125.9x.
High P/Es require high EPS growth to sustain them. In the case of Tesla, the company has recently shown a 27% shrinkage in Uniform EPS.
Wall Street analysts provide stock and valuation recommendations that in general provide very poor guidance or insight. However, Wall Street analysts’ near-term earnings forecasts tend to have relevant information.
We take Wall Street forecasts for GAAP earnings and convert them to Uniform earnings forecasts. When we do this, Tesla’s Wall Street analyst-driven forecasts are 816% and 73% EPS growth in 2021 and 2022, respectively.
Based on current stock market valuations, we can back into the required earnings growth rate that would justify $675.50 per share. These are often referred to as market embedded expectations.
The company is currently being valued as if Uniform earnings were to grow by 96% annually over the next three years. What Wall Street analysts expect for Tesla’s earnings growth is well above what the current stock market valuation requires in 2021 and below what the current stock market valuation requires in 2022.
Although the company’s earning power is below the corporate average, cash flows and cash on hand are almost 4x of its total obligations—including debt maturities, capex maintenance, and dividends. Together, this signals low credit and dividend risk.
To conclude, Tesla’s Uniform earnings growth is well above its peer averages, as well as its valuations with average peers.
Best regards,
Joel Litman & Rob Spivey
Chief Investment Strategist &
Director of Research
at Valens Research