
Are Chinese stocks really cheap? This large-cap China ETF has the answer

China has been a difficult investing market over the last year.
Today we look at an ETF that tracks the returns of the 50 largest equities listed on the Hong Kong Stock Exchange. Using Uniform Accounting, we’ll analyze the iShares China Large-Cap ETF to help you understand the impact of recent policy shifts on valuations.
In addition to examining the portfolio, we’re including a deeper look into the fund’s largest current holding, providing you with the current Uniform Accounting Performance and Valuation Tearsheet for that company.
Investor Essentials Daily:
Friday Uniform Portfolio Analytics
Powered by Valens Research
One of the biggest stories capturing the attention of investors and the media over the past few months has been the war declared against U.S.-listed Chinese companies by regulators in both Washington and Beijing.
In China, President Xi Jinping has launched a series of crackdowns on industries such as private education and technology, wiping out billions of dollars in market capitalization as the Communist Party seeks to assert control over what it deems to be free-wheeling markets and a “disorderly expansion” of capital.
This has resulted in dramatic, unexpected policy decisions such as removing DiDi Global (DIDI)’s ride-sharing app from Chinese app stores days after its IPO in New York, as well as requiring private tutoring companies such as U.S.-listed TAL Education (TAL) to convert themselves into non-profits.
Meanwhile, in the U.S., regulators have come under increasing pressure in recent years to enhance scrutiny of Chinese companies listed on American exchanges. Former President Donald Trump had signed into law the Holding Foreign Companies Accountable Act, which mandates that companies that fail to abide by U.S. auditing standards after three years must be delisted.
How the controversy unfolds could lead to dramatic changes for the companies in question, whose combined market value stands at $1.5 trillion, and who have for years enjoyed immense benefits from raising capital on U.S. markets.
The companies could choose to delist themselves in an orderly manner, opening up secondary listings in places like Hong Kong as Tencent (SEHK:700) and Alibaba (SEHK:9988) have done, or they could be removed by force if they fail to meet U.S. regulatory requirements over the next three years.
This forced delisting scenario could have serious implications for investors who have large positions in the U.S.-listed shares, but it also creates headaches for many who want exposure to the Chinese economy and its massive growth potential, as well as the often monopolistic earnings of many of its companies largely protected from international competition.
Fortunately, there is another way for people to get exposure to China: by investing directly into names with listings on the Hong Kong Stock Exchange (SEHK).
One of the most popular ways to do this is through the iShares China Large-Cap ETF (FXI), which gives investors exposure to the 50 largest equities trading in Hong Kong.
While not classified as A-shares, which represent direct ownership stakes in Chinese companies but are often inaccessible to foreign investors, shares trading in Hong Kong provide investors exposure to some of the world’s most innovative technology companies without the overhang of delisting risks.
To see how profitable these companies truly are, we’ve utilized Uniform Accounting to conduct a portfolio review of the iShares China Large-Cap ETF’s latest non-financial holdings.
Take a look for yourself.

Some of these companies, such as Tencent and Alibaba, have grown over the past 20 years to become some of the largest technology giants in the world, while others such as Meituan (SEHK:3690) and JD.com (SEHK:9618) have recently broken onto the scene as fast-growing disruptors.
In fact, while many initially labeled Chinese technology companies as copy-cats of their Western counterparts, their incredible abilities to innovate in certain areas such as gaming and mobile payments have far surpassed those of America’s Big Tech giants, which are now seeking to catch up.
Yet, looking at as-reported financial metrics, you’d see this fund as a portfolio of companies averaging return on assets (“ROA”) of 5% a year, right around cost of capital levels. This suggests meager profitability or even unprofitability, not leading innovation.
This is because Generally Accepted Accounting Principles (GAAP), the rulebook companies must follow when reporting their performance, has many fundamental flaws. Here at Valens, we have made it our mission to cut through that noise to deliver a real, consistent representation of corporate profitability through our Uniform Accounting framework.
On a Uniform basis, the average ROA for these names is not 5%, it’s actually 39%. This is well above the U.S. corporate average Uniform ROA of 12%.
Take a look at the ETF’s two largest holdings, Tencent and Alibaba, whose Uniform ROA exceed as-reported ROA by 95% and 118%, respectively. Tencent, for its part, dominates in areas like gaming and social media with its WeChat app, while Alibaba operates e-commerce platforms that boast over 900 million monthly active users as well as a growing cloud computing business.
However, just finding innovative companies with strong economic productivity isn’t enough to make them investible. To truly unlock alpha, investors need to find companies that are more productive than the market realizes.
Looking at the chart below, which uses our embedded expectations framework to see what the market is pricing in, we can discover if investors are rewarding the true profitability these companies exhibit, or if there are some major mispricings.
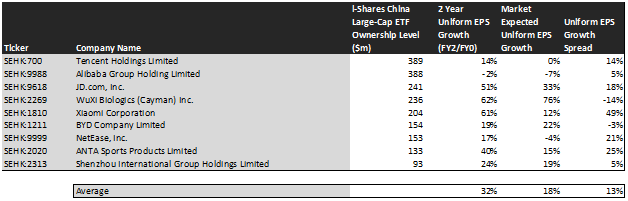
This chart shows three interesting data points:
– The first datapoint is what Uniform earnings growth is forecast to be over the next two years, when we take consensus Wall Street estimates and we convert them to the Uniform Accounting framework. This represents the Uniform earnings growth the company is likely to have, the next two years.
– The second datapoint is what the market thinks Uniform earnings growth is going to be for the next two years. Here, we are showing how much the company needs to grow Uniform earnings in the next two years to justify the current stock price of the company. If you’ve been reading our daily and our reports for a while, you’ll be familiar with the term embedded expectations. This is the market’s embedded expectations for Uniform earnings growth.
– The final datapoint is the spread between how much the company’s Uniform earnings could grow if the Uniform Accounting adjusted earnings estimates are right, and what the market expects Uniform earnings growth to be.
With analyst forecasted average earnings growth of 32% outperforming priced-in expected earnings growth of 18%, this fund appears to be undervalued by the market.
The standout name among these undervalued companies is smartphone and electronics maker Xiaomi (SEHK:1810). The market is pricing in a modest 12% increase in earnings per share (“EPS”) over the next two years, but analysts are far more bullish, penciling in estimates for Uniform EPS to grow by 61% over the same timeframe.
Similarly, sports apparel giant ANTA Sports Products (SEHK:2020), which owns the rights to the FILA brand in China, Macau, and Hong Kong, has a priced-in earnings expansion of 15%. Meanwhile, analysts believe earnings will actually expand by 40% as the company continues its impressive growth.
This ETF offers investors targeted exposure to one of the world’s largest and fastest growing economies, and with valuations looking increasingly attractive due to the recent selloff, there certainly may be buying opportunities within this space.
Yet, blindly buying a passive fund to track a theme like China, a country especially fraught with political risks and a lack of transparency, can be a risky decision for investors.
Many companies listed on the Hong Kong Stock Exchange are still structured under what is known as a Variable Interest Entity (“VIE”), a complex legal arrangement that is essentially akin to a shell company.
How it works is as follows: a VIE will be incorporated “offshore,” usually in a place like the Cayman Islands, to raise capital while getting around Chinese regulations on foreign investment. This entity will then offer shares to foreign investors, which in essence represent contracts that entitle those investors to a stream of the mainland company’s profits.
We believe it is important for investors to be clear-eyed about risks associated with VIEs. Ownership of shares represents ownership in an offshore holding company, not direct ownership in the company itself.
In recent weeks, the Chinese government has expressed interest in changing its stance on the VIE practice, which it has historically turned a blind eye to. While the extent of new regulations remains unclear, there does remain the possibility that all VIEs are shut down, leaving foreign investors empty-handed.
That’s why here at Valens, rather than concentrating on a single theme, we seek to help clients navigate idiosyncratic risk and stay informed about the best stocks across what we see as the investable universe.
SUMMARY and Tencent Holdings Limited Tearsheet
As one of iShares Trust – iShares China Large-Cap ETF’s largest individual stock holdings, we’re highlighting Tencent‘s tearsheet today.
As the Uniform Accounting tearsheet for Tencent Holdings Limited (700:HKG) highlights, its Uniform P/E trades at 16.7x, which is below the global corporate average of 21.9x and around its own historical average of 18.5x.
Low P/Es require low EPS growth to sustain them. In the case of Tencent, the company has recently shown a 23% Uniform EPS growth.
Sell-side analysts provide stock and valuation recommendations that in general provide very poor guidance or insight. However, sell-side analysts’ near-term earnings forecasts tend to have relevant information.
We take sell-side forecasts for Hong Kong Financial Reporting Standards (HKFRS) earnings and convert them to Uniform earnings forecasts. When we do this, Tencent’s sell-side analyst-driven forecast is for EPS to grow by 21% and 8% in 2021 and 2022, respectively.
Based on current stock market valuations, we can back into the required earnings growth rate that would justify Tencent’s HKD 466 stock price. These are often referred to as market embedded expectations.
The company is currently being valued as if Uniform earnings were to grow 1% annually over the next three years. What analysts expect for Tencent’s earnings growth is above what the current stock market valuation requires for both 2021 and 2022.
Furthermore, the company’s earning power is 17x the corporate average. Also, cash flows and cash on hand are 5x above its total obligations—including debt maturities, capex maintenance, and dividends. This signals a low credit and dividend risk.
To conclude, Tencent’s Uniform earnings growth is below peer averages, but the company is trading in line with its average peer valuations.
Best regards,
Joel Litman & Rob Spivey
Chief Investment Strategist &
Director of Research
at Valens Research