
Ground Zero For The Trade War And Feeling Fine

There has been significant carnage on both sides of the Pacific from the trade war.
It has disrupted telecom equipment and phone supply chains. It has caused significant pain and uncertainty in the agriculture markets. It has changed how management teams think about long-term strategies around where they source clothes that are sold, and components for cars.
But the industry most directly impacted by the trade war is the industry that supports all those other industries.
Transportation.
When trade slows, the transportation sector gets hit hard. This is why FedEx has been down from $250+ in early 2018 to $140 today.
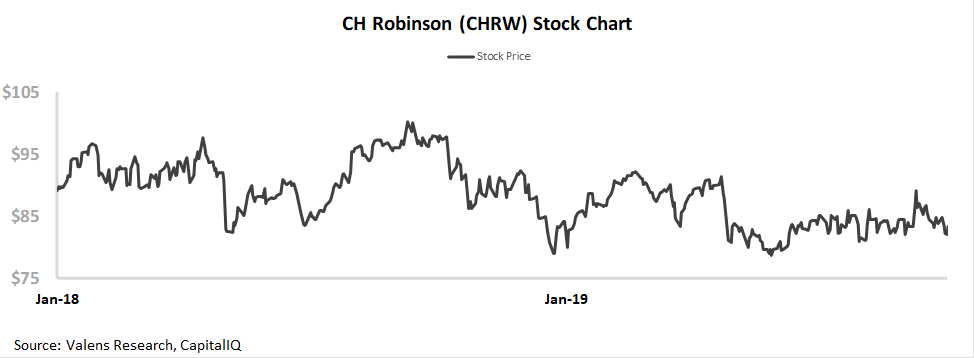
CH Robinson (CHRW) is a logistics company at the heart of world trade. They match customers who need to ship things with shippers, and handle the logistics so things can traverse the globe smoothly.
And yet, while FedEx has been down 44% since the beginning of 2018, CH Robinson is down only 8%. Considering the headlines, investors would not be blamed for expecting CHRW to be down significantly more.
However, CH Robinson has not come under pressure due to these issues. In fact, returns actually improved from 2017 to 2018, and analysts expect them to remain robust in 2019.
They’ve been able to achieve this by being nimble, but more importantly by being asset light. CH Robinson does not own any of the shipping assets they leverage, which allows them to not be on the hook when an economic slowdown happens. They also have built long-term relationships with their customers to protect themselves in times of volatility like the most recent quarters.
These strategies are why the company’s returns are over 5x what FedEx and UPS’ returns are after we make Uniform Accounting adjustments and remove the accounting noise. This strategy is why the company’s returns are 3x what as-reported metrics imply, when Uniform Accounting adjustments are made.
But even though the stock hasn’t fallen as much as FedEx’s has, the market doesn’t appear to realize how good the company’s business is. The market is expecting a decline in returns going forward, just when the company is actually improving operations.
And we’re seeing interesting signs from management’s recent calls that say there might be more to the story going forward.
A Special Offer
This week we’re making a special webinar available to the readers of our Valens Research Institutional Daily.
This Thursday, at noon EST, we’re hosting a webinar to review our US equities Conviction Long Idea List.
Our Director of Research, Rob Spivey, will be highlighting our process for idea generation, and talking about our top picks, and our new picks for the quarter.
To register, click here. For Thursday, October 10th, at 12pm EST.
We look forward to having you on the webinar. It is a great introduction to how to use Uniform Accounting and Valens’ research in your own investing process.
Market expectations are for Uniform ROA to fade to new lows, but management is confident about cash flow, growth, and acquisitions
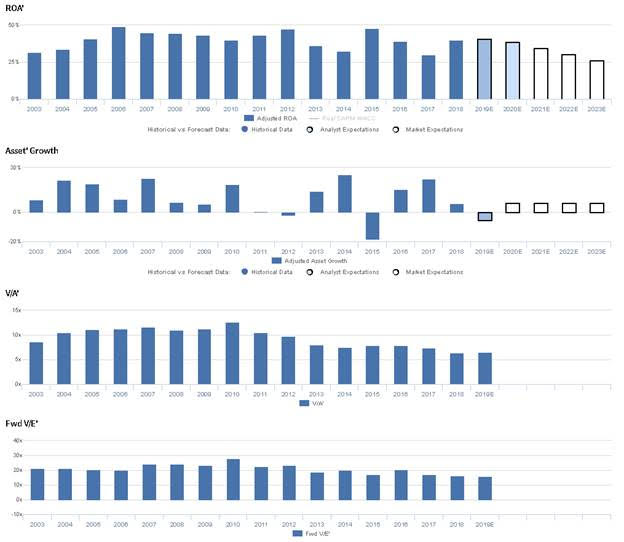
CHRW currently trades below historical averages relative to UAFRS-based (Uniform) Earnings, with a 15.9x Uniform P/E. At these levels, the market is pricing in expectations for Uniform ROA to compress from 40% in 2018 to 26% in 2023, accompanied by 6% Uniform Asset growth going forward.
However, analysts have less bearish expectations, projecting Uniform ROA to only decline to 39% in 2020, accompanied by 5% Uniform Asset shrinkage.
Historically, CHRW has seen robust, cyclical profitability. After expanding from 32% in 2003 to a peak of 49% in 2006, Uniform ROA compressed to 40% in 2010, before rebounding to 47% in 2012, and compressing to 33% in 2014. Subsequently, Uniform ROA jumped to 48% in 2015, before fading to 30% in 2017, and recovering to 40% in 2018. Meanwhile, Uniform Asset growth has been somewhat volatile, positive in fourteen of the past sixteen years, while ranging from -18% to 25%.
Performance Drivers – Sales, Margins, and Turns

Cyclical trends in Uniform ROA have been driven by compounding trends in Uniform Earnings Margin and Uniform Asset Turns. Uniform Margins expanded from 3% in 2003 to 5% in 2009, before declining to 4% in 2013, and recovering to 5% in 2018. Meanwhile, Uniform Turns ranged from 8.5x-10.5x from 2003-2013, before falling to 8.1x in 2014, recovering to 10.4x in 2015, and compressing to 7.9x in 2018. At current valuations, markets are pricing in expectations for continued Uniform Turns compression, coupled with a reversal of recent Uniform Margins improvements.
Earnings Call Forensics
Valens’ qualitative analysis of the firm’s Q2 2019 earnings call highlights that management is confident they have increased cash flow from operations and cash return to shareholders, and they are confident their pricing adjustments have improved their bid rate. Furthermore, they are confident their growth is from industry conversion rather than new entrants and that their routing guide depth is the lowest they have seen in the last decade. Moreover, they are confident they have growth runway in several geographies and that their peak seasons are more pronounced due to e-commerce. Finally, they are confident they will spend more on technology to better leverage their data and they will continue to look at acquisitions that fill geographic space.
However, management may be concerned about the sustainability of recent engagement levels with their international customers, and they may lack confidence in their ability to sustain their contractual bids win rate. Furthermore, they may be concerned about the value of their data science investments and about the launch of their new Freightquote product. Finally, they may be concerned about the sustainability of recent interest rates on their debt.
UAFRS VS As-Reported
Uniform Accounting metrics also highlight a significantly different fundamental picture for CHRW than as-reported metrics reflect. As-reported metrics can lead investors to view a company to be dramatically stronger or weaker than real operating fundamentals highlight. Understanding where these distortions occur can help explain why market expectations for the company may be divergent.
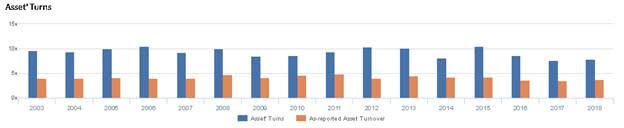
As-reported metrics significantly understate CHRW’s asset efficiency, one of the primary drivers of profitability. For example, as-reported asset turnover for CHRW was 3.8x in 2018, materially lower than Uniform Asset Turns of 7.9x in the same year, making CHRW appear to be a much weaker business than real economic metrics highlight. Moreover, since 2003, as-reported asset turnover has been less than half of Uniform Turns in each year, significantly distorting the market’s perception of the firm’s historical profitability trends.
Today’s Tearsheet
Today’s tearsheet is for Amazon. Amazon’s UAFRS valuations remain elevated, and while the company’s historical EPS growth has been strong, it is forecast to be more muted in 2019 and 2020, which may disappoint market expectations.
Regards,
Joel Litman
Chief Investment Strategist