
Contrary to as-reported accounting, this company’s products are saving clients time and setting this company up to make loads of money

This information technology company is making life easier for employees all over the world.
As-reported metrics would have you believe this company’s strategy has left it with no growth and returns well below cost-of-capital levels, but true UAFRS (Uniform) based analysis shows the firm’s real profitability.
Also below, Uniform Accounting Embedded Expectations Analysis and the Uniform Accounting Performance and Valuation Tearsheet for the company.
Investor Essentials Daily:
Thursday Tearsheets
Powered by Valens Research
One of the most dreaded tasks on a monthly basis for any employee is expense reimbursement. It requires gathering receipts, entering in all the information manually, and sometimes battling with your company on what is and is not reimbursable. At times, it feels like it is a punishment for having spent money the company required you to spend, not a mundane process.
The services many companies use are outdated and do not cater well to the current complexities of the modern firm. As such, a company with the capability to make the process easier would probably be very popular. Even more so if it could cut costs.
Wex Inc. (WEX) seeks to do exactly that by offering companies with large commercial fleets an easier way to manage gas costs through Wex’s fleet cards. These cards enable companies to track fuel spend and control spending, all while Wex handles the paperwork. The card also gives companies discounts on fuel and tires.
In addition, Wex offers firms normal corporate cards and cloud-based healthcare platforms. These products further allow companies to streamline non-operational activities in order to save time and money.
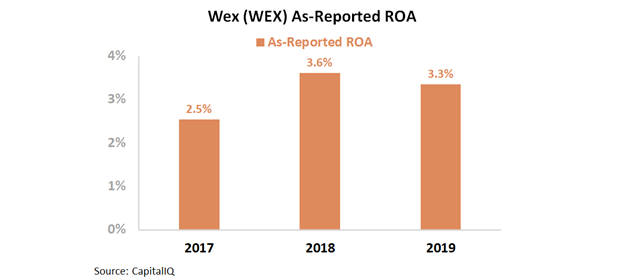
All these products are vital for businesses, and so one would expect a company that offers a simple way to deliver them to earn a premium return. However, Wex has not been able to grow its as-reported return on assets (ROA) in recent years from middling levels. Over the past three years, ROA has held steady between 3% and 4%, well below corporate averages and cost-of-capital levels.
However, this depiction of Wex’s profitability is not accurate. Accounting around goodwill & intangibles are overstating the firm’s asset base, and interest expenses are distorting the firm’s earnings.
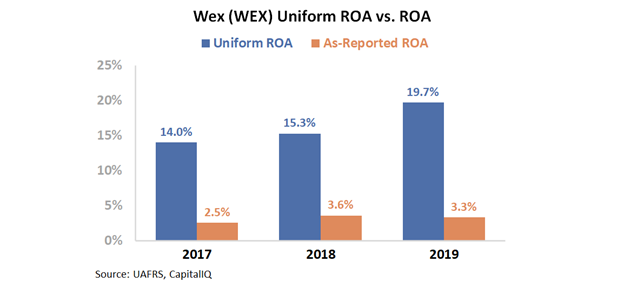
These distortions, among others, are keeping as-reported ROA artificially low. In reality, Uniform Accounting shows an ROA in excess of corporate averages, reaching 20% in 2019. Moreover, Uniform ROA improved in each of the past three years.
Companies are realizing the ease of Wex’s system, and growing profitability shows the firm’s fleet card is becoming more popular.
That’s all well and good, and the company is doing well. But high returns alone don’t make for a compelling stock. In order to understand the stock’s potential, it is necessary to look at valuations. In order to do so, we use our Embedded Expectations Framework.
The chart below explains the company’s historical corporate performance levels, in terms of ROA (dark blue bars) versus what sell-side analysts think the company is going to do in the next two years (light blue bars) and what the market is pricing in at current valuations (white bars).
Due to poor macroeconomic conditions, sell-side analysts are expecting Uniform ROA to slightly decline over the following two years, and not continue the recent ramp higher.
The market also has similar expectations, assuming an 18% Uniform ROA between 2022 and 2024.
Wex has been able to grow profitability immensely in recent years, as shown by its doubling of Uniform ROA in only four years. If Wex is able to continue providing value to customers, these market expectations should not be difficult to surpass.
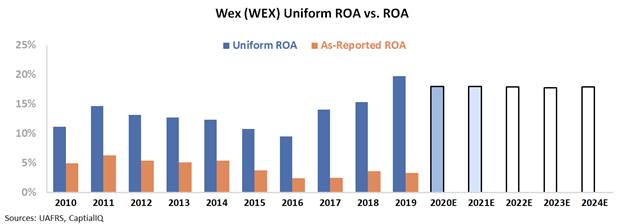
Uniform profitability metrics are able to show increased growth in recent years as more companies outsource non-operational functions. Furthermore, the firm’s expectations appear to be very achievable, as Uniform ROA is expected to stay in the high teens.
Without Uniform Accounting, investors could miss a growing company able to cure one of the office’s greatest pains.
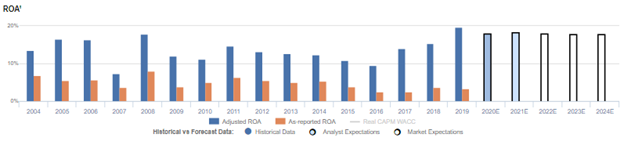
WEX Inc. Embedded Expectations Analysis – Market expectations are for Uniform ROA to remain stable, but management may have concerns about growth, leverage, and their acquisition termination

WEX currently trades near recent averages relative to Uniform earnings, with a 21.2x Uniform P/E (Fwd V/E’). At these levels, the market is pricing in expectations for Uniform ROA to slightly decline to 18% levels through 2024, accompanied by 4% Uniform asset growth going forward.
Meanwhile, analysts have similar expectations, projecting Uniform ROA to fade to 18% levels through 2021, accompanied by 3% Uniform asset shrinkage.
Historically, WEX has seen generally robust, yet volatile profitability. Uniform ROA rose from 14% in 2004 to 18% in 2008, excluding 7% underperformance in 2007, before falling to 11% in 2010 and subsequently jumping to 15% in 2011.
Then, after compressing to 10% in 2016, Uniform ROA expanded to a peak of 20% in 2019.
Meanwhile, Uniform asset growth has been fairly consistent, positive in fourteen of the past sixteen years, while ranging from -18% to 44%.
Performance Drivers – Sales, Margins, and Turns

Trends in Uniform ROA have been driven by compounding trends in Uniform earnings margins and Uniform asset turns.
Uniform margins improved from 25% in 2004 to 33% in 2006, before collapsing to 18% in 2007 and rebounding to 27%-31% levels through 2014. Thereafter, Uniform margins faded to 20% in 2016, before recovering to 28% in 2019.
Meanwhile, Uniform turns maintained 0.4x-0.5x levels from 2005 to 2017, excluding 0.6x outperformance in 2008, before expanding to a peak of 0.7x in 2019.
At current valuations, the market is pricing in expectations for Uniform margins to stabilize near current levels and for Uniform turns to remain near historical peaks.
Earnings Call Forensics
Valens’ qualitative analysis of the firm’s Q1 2020 earnings call highlights that management is confident that they remain committed to providing best-in-class services without compromising employee safety and that their U.S. health business continues to be strong.
However, they may lack confidence in their ability to sustain net late fee increases by driving new business wins and maintain revenue and earnings growth amidst coronavirus-driven headwinds.
Furthermore, they may have concerns about headwinds related to backing out of the eNett and Optal acquisition, as well as related litigation, and about the state of the health care supply chain.
In addition, management may lack confidence in their ability to maintain their leverage ratio, and they may be exaggerating their liquidity position and ability to grow and serve customers post-coronavirus. Finally, they may lack confidence in their ability to mitigate credit losses.
UAFRS VS As-Reported
Uniform Accounting metrics also highlight a significantly different fundamental picture for WEX than as-reported metrics reflect.
As-reported metrics can lead investors to view a company to be dramatically stronger or weaker than real operating fundamentals highlight. Understanding where these distortions occur can help explain why market expectations for the company may be divergent.
As-reported metrics significantly understate WEX’s profitability. For example, as-reported ROA for WEX was 3% in 2019, well below its Uniform ROA of 20%, making WEX appear to be a much weaker business than real economic metrics highlight.
Moreover, since 2016, as-reported ROA has maintained 3%-4% levels through 2019, while Uniform ROA has doubled from 10% to 20% over the same timeframe, directionally distorting the market’s perception of the firm’s recent profitability trends.
SUMMARY and WEX Inc. Tearsheet
As the Uniform Accounting tearsheet for WEX Inc. (WEX:USA) highlights, the Uniform P/E trades at 21.2x, which is below corporate average valuation levels, but around its own history.
Low P/Es require low EPS growth to sustain them. In the case of WEX, the company has recently shown a 5% growth in Uniform EPS.
Wall Street analysts provide stock and valuation recommendations that in general provide very poor guidance or insight. However, Wall Street analysts’ near-term earnings forecasts tend to have relevant information.
We take Wall Street forecasts for GAAP earnings and convert them to Uniform earnings forecasts. When we do this, WEX’s Wall Street analyst-driven forecast is a 17% shrinkage in 2020, before a 20% EPS growth in 2021.
Based on the current stock market valuations, we can use earnings growth valuation metrics to back into the required growth rate to justify WEX’s $160 stock price. These are often referred to as market embedded expectations.
The company can have its Uniform earnings shrink by 1% each year over the next three years and still justify current prices. What Wall Street analysts expect for WEX’s earnings growth is below what the current stock market valuation requires in 2020, but above its requirement in 2021.
Furthermore, the company’s earning power is 3x corporate average. In addition, cash flows are above their total obligations—including debt maturities and capex maintenance. Together, this signals an average credit risk.
To conclude, WEX’s Uniform earnings growth is in line with its peer averages. Also, the company is trading above average peer valuations.
Best regards,
Joel Litman & Rob Spivey
Chief Investment Strategist &
Director of Research
at Valens Research


