
Contrary to distorted as-reported metrics, this company thrives off the spending habits of high-income earners looking for a bargain

This discount store operator has a unique business model and an incredibly loyal following among its customers.
As-reported metrics would have you believe this company’s discount strategy has left it with returns only slightly above cost-of-capital, but true UAFRS (Uniform) based analysis shows the firm’s real profitability.
Also below, Uniform Accounting Embedded Expectations Analysis and the Uniform Accounting Performance and Valuation Tearsheet for the company.
Investor Essentials Daily:
Tuesday Tearsheets
Powered by Valens Research
It is often said many wealthy people get to where they are by being thrifty. Millionaires often look for deals and do not spend money where it is not necessary.
Warren Buffet is the perfect example of this. He still lives in the house he bought in 1958 for $31,500, despite being one of the richest men of the modern age.
Steve Jobs was famous for being incredibly frugal as well. He was known to live in houses with no furniture and balk at spending too much money at the grocery store.
The world’s former richest man Carlos Slim still lives in the same house he bought over 40 years ago. Slim is also known to drive old cars, and skip the typical luxurious lifestyle of private jets and yachts.
Our Director of Research Rob Spivey has a story from a ski trip with hedge fund colleagues that confirms the pattern. One of the hedge fund managers hosting the event spent a great deal of time not talking about any wealth, but about talking about how much he’d saved supplying the trip with all of the Costco (COST) products he had around his house. He loved to mention how cost effective it was and the money he saved.
Costco has gained a cult-like following for its warehouse atmosphere and massive bulk purchases. Costco sells everything from groceries to engagement rings.
It has become the destination store to go to for virtually every aspect of shoppers’ lives. Costco has even removed all aisle signs to encourage shoppers to wander around more. This drives higher sales, as people purchase unexpected items.
Costco has done an incredible job of appealing to above-average earners looking for cheaper products. The average Costco member had a family income of $93,000, well above the national average.
More than 98 million people worldwide pay an annual membership fee just to get inside Costco. Additionally, less than 10% a year decide not to renew. This is an incredibly sticky customer base.
At first glance, it looks like these high earners are doing such a great job saving money, that Costco’s returns are being capped.
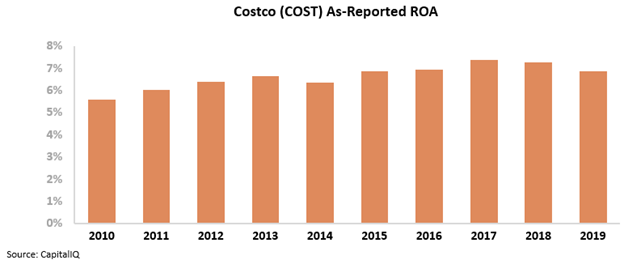
Looking at as-reported metrics, it would appear Costco’s returns have seen almost no meaningful growth during the last decade.
Its as-reported return on assets (ROA) has settled between 6%-7% over the last 10 years. Those looking at as-reported numbers see Costco only as a low-return business, unable to capitalize on their massive and sticky customer base.
However, this picture of Costco’s performance is inaccurate, pulled down by distortions in as-reported accounting.
Costco has managed to successfully create a unique shopping experience, capable of weathering economic disruptions.
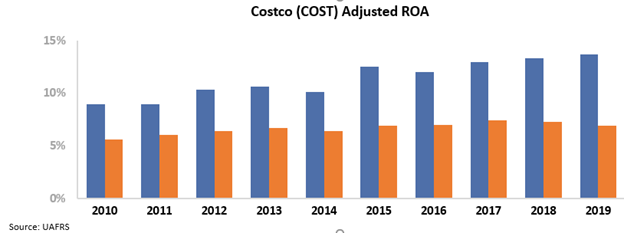
In fact, Costco’s Uniform ROA was almost double the as-reported metrics by 2019, growing from 9% in 2010 to 14% over the same time frame that as-reported metrics showed a stagnating and low return.
While it looks like the shoppers are the ones getting a bargain, Costco is clearly profiting with expanding returns.
Costco excels at driving customer loyalty, and creates recurring revenue through memberships. Customers are willing to not only pay for the store items, but also for an annual membership just to walk through the door.
Just because Costco is a strong business, it does not necessarily mean the stock is a good buy though. We can use the Embedded Expectations Framework to easily understand market valuations and the buying potential.
The chart below explains the company’s historical corporate performance levels, in terms of ROA (dark blue bars) versus what sell-side analysts think the company is going to do in the next two years (light blue bars) and what the market is pricing in at current valuations (white bars).
As you can see, the market expects returns to grow well beyond current levels. This is despite the massive economic uncertainty and record unemployment numbers caused by the current pandemic.
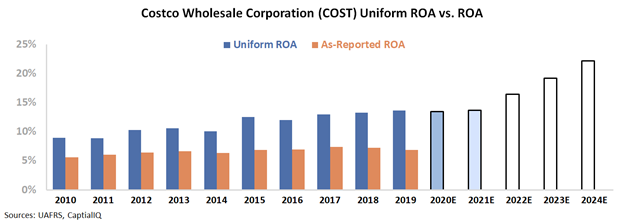
Costco has demonstrated incredible resilience. However, investors appear to have excessive expectations even for this impressive business.
For Costco to justify the current stock price, it would need to almost double its current returns within five years. While Costco has proven its profitability, this seems like a tall ask.
Without Uniform Accounting, investors would misunderstand a high-return company with an incredibly sticky customer base and recurring revenue for one with stagnant profitability. However, they also would have no way to approach understanding why investors are so excited about this company, even if they may be too excited.
Costco Wholesale Corporation Embedded Expectations Analysis – Market expectations are for material Uniform ROA expansion, but management may be concerned about sales, margins, and their food courts
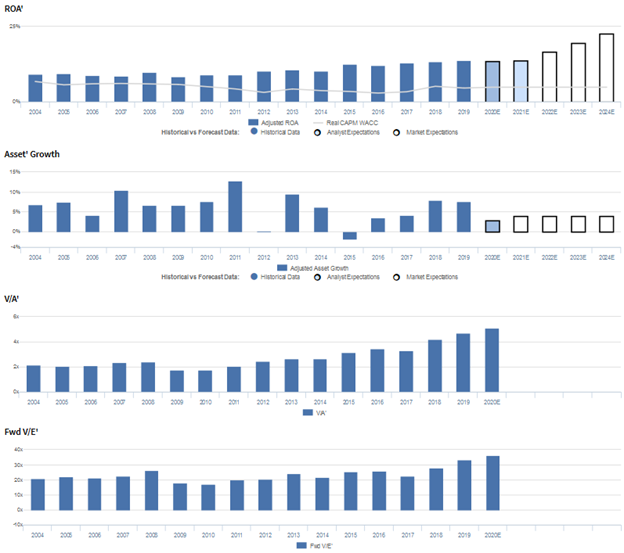
COST currently trades at historical highs relative to Uniform earnings, with a 36.1x Uniform P/E (Fwd V/E’). At these levels, the market is pricing in expectations for Uniform ROA to expand from 14% in 2019 to a high of 23% in 2024, accompanied by 4% Uniform asset growth going forward.
Meanwhile, analysts have less bullish expectations, projecting Uniform ROA to sustain 14% levels through 2021, accompanied by 3% Uniform asset growth.
Historically, COST has seen gradually improving profitability, with Uniform ROA remaining at 8%-11% levels from 2004 through 2014, before expanding to 14% in 2019. Meanwhile, the firm has seen consistent Uniform asset growth, positive in fifteen of the past sixteen years, while ranging from -2% to 13%.
Performance Drivers – Sales, Margins, and Turns

Trends in Uniform ROA have been driven primarily by incremental improvements in Uniform earnings margins, coupled with stable Uniform asset turns.
From 2004-2019, Uniform margins gradually improved from 2%-3%. Meanwhile, Uniform turns have ranged from 4.8x to 5.4x since 2004 and currently sit near the middle of that range.
At current levels, the market is pricing in expectations for further expansion in Uniform margins and for Uniform turns to reach new peaks.
Earnings Call Forensics
Valens’ qualitative analysis of the firm’s Q3 2020 earnings call highlights that management may have concerns about eliminating their food court seating, limiting their food court menu, and estimated loss of sales due to closed or restricted items.
In addition, they may lack confidence in their ability to maintain their comparable store sales growth, renewal rate improvements, and gasoline gross margin strength.
Furthermore, they may be concerned about FX headwinds, core merchandise category margin declines, and costs attributed to coronavirus.
Meanwhile, they may lack confidence in their ability to sustain hand sanitizer, office item, seafood, and produce performance.
Additionally, they may have concerns about their core operations SG&A expenses, interest and principal payments from their outstanding debt, and their same-day grocery program.
Moreover, management may lack confidence in their ability to market both online and physical shopping and assist small food service-related businesses, and they may be concerned about reducing the selection of Christmas merchandise.
Finally, they may be overstating their Innovel acquisition’s ability to boost higher ticket, big and bulky items sales, the effectiveness of their online inventory management, and the popularity of roadshows and their executive membership options.
UAFRS VS As-Reported
Uniform Accounting metrics also highlight a significantly different fundamental picture for COST than as-reported metrics reflect.
As-reported metrics can lead investors to view a company to be dramatically stronger or weaker than real operating fundamentals highlight.
Understanding where these distortions occur can help explain why market expectations for the company may be divergent.
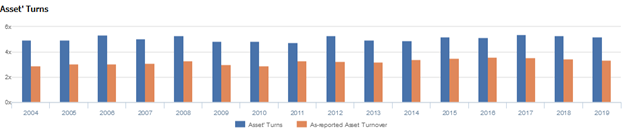
As-reported metrics significantly understate COST’s asset utilization, one of the key drivers of profitability.
For example, as-reported asset turnover for COST was 3.4x in 2019, materially lower than Uniform turns of 5.2x, making COST appear to be a less efficient business than real economic metrics highlight.
Moreover, as-reported asset turnover has been well below Uniform turns in each year since 2004, significantly distorting the market’s perception of the firm’s asset efficiency trends for almost two decades.
SUMMARY and Costco Wholesale Corporation Tearsheet
As the Uniform Accounting tearsheet for Costco Wholesale Corporation (COST:USA) highlights, the Uniform P/E trades at 36.1x, which is above corporate average valuation levels and historical averages.
High P/Es require high EPS growth to sustain them. In the case of Costco, the company has recently shown a 15% Uniform EPS growth.
Wall Street analysts provide stock and valuation recommendations that in general provide very poor guidance or insight. However, Wall Street analysts’ near-term earnings forecasts tend to have relevant information.
We take Wall Street forecasts for GAAP earnings and convert them to Uniform earnings forecasts. When we do this, Costco’s Wall Street analyst-driven forecast an EPS growth of 3% and 7% in 2020 and 2021, respectively.
Based on the current stock market valuations, we can use earnings growth valuation metrics to back into the required growth rate to justify Costco’s $336 stock price. These are often referred to as market embedded expectations.
The company needs to have Uniform earnings grow by 14% each year over the next three years to justify current prices. What Wall Street analysts expect for Costco’s earnings growth is below what the current stock market valuation requires.
Furthermore, the company’s earning power is 2x the corporate average. Also, cash flows are significantly higher than its total obligations—including debt maturities, capex maintenance, and dividends. Together, this signals low credit and dividend risk.
To conclude, Costco’s Uniform earnings growth is above peer averages. Therefore, as is warranted, the company is also trading above average peer valuations.
Best regards,
Joel Litman & Rob Spivey
Chief Investment Strategist &
Director of Research
at Valens Research