
Uniform Accounting shows this retailer’s subscription business isn’t only a money-making strategy for software firms

A recurring revenue model can be one of the most effective business strategies thanks to the consistent stream of income.
Looking at as-reported numbers, it appears today’s firm generates below cost-of-capital returns with no expectation for growth. However, on a closer look, its strategy produces much stronger profitability.
Also below, Uniform Accounting Embedded Expectations Analysis and the Uniform Accounting Performance and Valuation Tearsheet for the company.
Investor Essentials Daily:
Thursday Tearsheets
Powered by Valens Research
As we have mentioned before, software as a service (SaaS) companies are all the rage right now. This is because a SaaS strategy can transform a company and its profitability.
Just look at Microsoft (MSFT) and Adobe (ADBE). These companies’ stocks are up over 700% in the past ten years because of their switch to a SaaS strategy. Microsoft’s Office Suite and Adobe’s Creative Cloud have created a consistent revenue stream for both firms.
Moreover, the recurring revenue model has other positives for companies.
The first is the reduction of risks. Companies often struggle to forecast how much money they will make; however, a company with a recurring business model is able to make reliable forecasts. This makes it easier to invest in long-term strategies.
Furthermore, the SaaS model saves time and money. It saves the time sales staff might have to spend re-signing existing customers, freeing up time for new business development. This allows the sales staff to pursue more opportunities and increase future sales.
While the SaaS model specifically refers to software companies, subscription-based models are not exclusive to this industry.
An example of this is Costco (COST). Costco has been a subscription business for over 40 years. To shop at Costco, a customer needs to pay a yearly subscription fee of $60 dollars. In return, customers get access to Costo’s cheap, wholesale prices on everyday items and groceries.
Thanks to the company’s subscription model, it sees consistent profitability levels. According to as-reported accounting, the firm has had a return on assets (ROA) between 6% and 8% for ten years in a row.
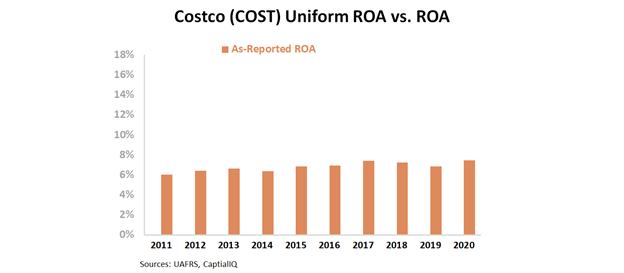
Since the firm has a low cost-of-capital between 3% and 5%, Costco is able to make a consistent, if slim economic profit.
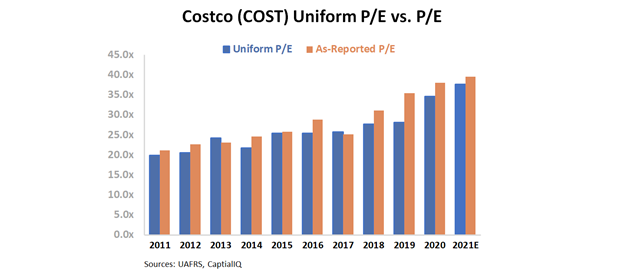
That’s good for investors, however it makes little sense as to why a firm with those characteristics trades a premium relative to its earnings. The firm’s price to earnings (P/E) ratio has been rising for years and is now at 39.5x.

However, this picture of the firm is inaccurate. GAAP’s treatment of accounts payable, among other line items, is suppressing the firm’s profitability and valuation metrics.
While Uniform P/E is still at elevated levels, it is not as high as as-reported metrics. The firm currently trades at a 33.7x Uniform P/E.
Moreover, the firm has an elevated P/E ratio because Costco is more profitable than GAAP metrics let on. Uniform ROA shows the firm had a 16% ROA this year, twice as high as as-reported levels.
Additionally, the firm’s profitability has been improving. Uniform ROA was only 9% in 2011 and has consistently improved since then.
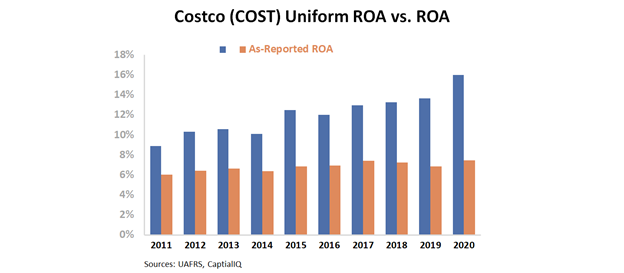
Only once we remove the accounting noise can we understand the effectiveness of Costco’s subscription model. Although not revolutionary, the subscription-based model has allowed Costco to sustain a high level of profitability.
Without Uniform Accounting, investors would miss out on an exciting company with a simple yet ingenious business strategy.
Costco Wholesale Corporation Embedded Expectations Analysis – Market expectations are for material Uniform ROA expansion, but management may be concerned about sales, margins, and their food courts
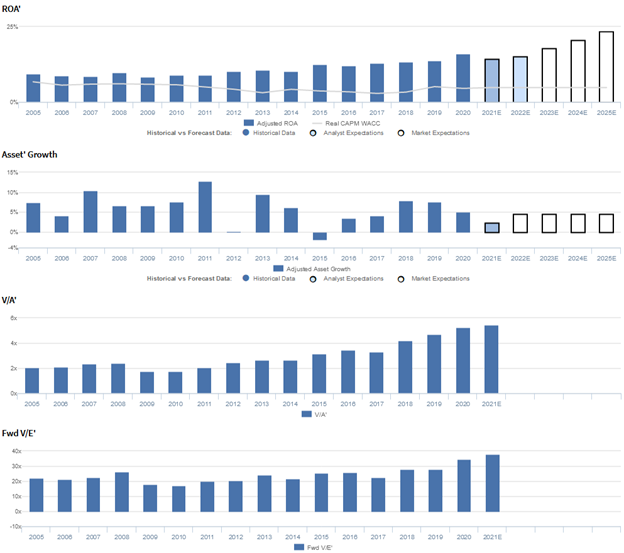
COST currently trades near historical highs relative to Uniform earnings, with a 37.7x Uniform P/E (Fwd V/E’). At these levels, the market is pricing in expectations for Uniform ROA to expand from 16% in 2020 to a high of 24% in 2025, accompanied by 5% Uniform asset growth going forward.
Meanwhile, analysts have bearish expectations, projecting Uniform ROA to fade to 15% levels through 2022, accompanied by 2% Uniform asset growth.
Historically, COST has seen gradually improving profitability, with Uniform ROA remaining at 8%-11% levels from 2004 through 2014, before expanding to 16% in 2020.
Meanwhile, the firm has seen consistent Uniform asset growth, positive in fifteen of the past sixteen years, while ranging from -2% to 13%.
Performance Drivers – Sales, Margins, and Turns
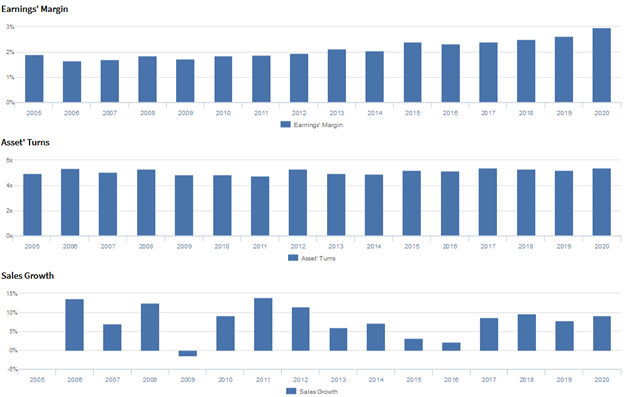
Trends in Uniform ROA have been driven primarily by incremental improvements in Uniform earnings margins, coupled with stable Uniform asset turns.
From 2005-2020, Uniform margins gradually improved from 2%-3%. Meanwhile, Uniform turns have ranged from 4.8x to 5.4x since 2005 and currently sits at the higher end of that range.
At current levels, the market is pricing in expectations for further expansion in Uniform margins and for Uniform turns to reach new peaks.
Earnings Call Forensics
Valens’ qualitative analysis of the firm’s Q3 2020 earnings call highlights that management may have concerns about eliminating their food court seating, limiting their food court menu, and estimated loss of sales due to closed or restricted items. In addition, they may lack confidence in their ability to maintain their comparable store sales growth, renewal rate improvements, and gasoline gross margin strength.
Furthermore, they may be concerned about FX headwinds, core merchandise category margin declines, and costs attributed to coronavirus. Meanwhile, they may lack confidence in their ability to sustain hand sanitizer, office item, seafood, and produce performance.
Additionally, they may have concerns about their core operations SG&A expenses, interest and principal payments from their outstanding debt, and their same-day grocery program. Moreover, management may lack confidence in their ability to market both online and physical shopping and assist small food service-related businesses, and they may be concerned about reducing the selection of Christmas merchandise.
Finally, they may be overstating their Innovel acquisition’s ability to boost higher ticket, big and bulky items sales, the effectiveness of their online inventory management, and the popularity of roadshows and their executive membership options.
UAFRS VS As-Reported
Uniform Accounting metrics also highlight a significantly different fundamental picture for COST than as-reported metrics reflect.
As-reported metrics can lead investors to view a company to be dramatically stronger or weaker than real operating fundamentals highlight. Understanding where these distortions occur can help explain why market expectations for the company may be divergent.
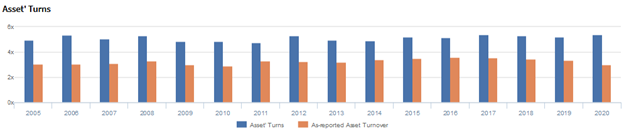
As-reported metrics significantly understate COST’s asset utilization, one of the key drivers of profitability.
For example, as-reported asset turnover for COST was 3.0x in 2020, materially lower than Uniform turns of 5.4x, making COST appear to be a less efficient business than real economic metrics highlight.
Moreover, as-reported asset turnover has been well below Uniform turns in each year since 2005, significantly distorting the market’s perception of the firm’s asset efficiency trends for almost two decades.
SUMMARY and Costco Wholesale Corporation Tearsheet
As the Uniform Accounting tearsheet for Costco Wholesale Corporation (COST:USA) highlights, the Uniform P/E trades at 37.7x, which is above the global corporate average valuation levels and its historical average valuations.
High P/Es require High EPS growth to sustain them. In the case of COST, the company has recently shown a 23% growth in Uniform EPS.
Wall Street analysts provide stock and valuation recommendations that in general provide very poor guidance or insight. However, Wall Street analysts’ near-term earnings forecasts tend to have relevant information.
We take Wall Street forecasts for GAAP earnings and convert them to Uniform earnings forecasts. When we do this, COST’s Wall Street analyst-driven forecast is a 6% EPS shrinkage in 2021, followed by an 11% EPS growth 2022.
Based on the current stock market valuations, we can use earnings growth valuation metrics to back into the required growth rate to justify COST’s $382 stock price. These are often referred to as market embedded expectations.
In order to justify current stock prices, the company would need to have Uniform earnings grow by 11% per year over the next three years. What Wall Street analysts expect for COST’s earnings growth is below what the current stock market valuation requires in 2021, but in line with its requirement in 2022.
Furthermore, the company’s earning power is 3x corporate average. Additionally, cash flows and cash on hand are significantly higher than its total obligations—including debt maturities, capex maintenance, and dividends. Together, this signals a low credit and dividend risk.
To conclude, COST’s Uniform earnings growth is in line with peer averages and the company is trading above its average peer valuations.
Best regards,
Joel Litman & Rob Spivey
Chief Investment Strategist &
Director of Research
at Valens Research