
Customers Pay this Company for the Right to Spend More in its Stores

Behavioral economics regularly highlights that humans are anything but the homo economicus that your introduction to economics professor so desperately wanted you to believe in.
Humans often are irrational in their decision making, do not make decisions in their own self interest, or let small changes in how different opportunities are framed dramatically change their choices.
Daniel Kahneman and Amos Tverskey are widely respected as having helped found the theory of behavioral economics. If you haven’t read it, Thinking, Fast and Slow is an (unsurprisingly) excellent book on the subject.
Their research took them on many subjects around behavior psychology, including around how anchoring, framing, loss aversion, prospect theory, and availability heuristics impact individuals’ decision making.
Anyone who’s analyzed Costco must wonder if James Sinegal and Jeffrey Brotman, the two founders of Costco, studied under Kahneman and Tverskey.
Costco spends an inordinate amount of time trying to understand its customers. There is a reason why, as recently as 2016, the sales per square foot at Target was $308, while it was $650 at Costco competitor Sam’s Club ($429/sqft for Walmart as a whole), and almost DOUBLE that at Costco, at $1,124 in sales per square foot.
There are several unique ways Costco applies behavioral economics to maximize revenue. They limit the number of options a customer has for any individual segment of their business.
They may offer only 3 or 4 brands of light bulbs, as opposed to dozens for competitors, in an effort to reduce decision fatigue for their customers. They also don’t put up signs over their aisles, so customers spend more time wandering from aisle to aisle, increasing the likelihood they’ll buy more products.
But the most powerful way that Costco drives higher revenue is by making their customers pay to come into their store in the first place.
A base Costco membership costs $60 currently, up from $55 a few years ago. Turning people away from buying goods from you might seem illogical if you are trying to create more revenue, but it is exactly what Costco does.
By charging a fee to get customers into the store, Costco creates a few benefits. One, customers who pay that fee are more likely to come back to guarantee they make back the cost of their membership. This is something of a sunk cost situation. Humans fixate on costs already spent when making economic decisions.
Also, Costco specifically communicates to their consumers that in their goal to maximize the value to their members, they actively seek to control prices and keep prices competitive and low overall. By creating a community approach, and making members feel like they are getting exclusive access, Costco is turning what was originally an economic decision to a combination of the emotionally rewarding membership to a community, with the economic benefits of lower costs.
Lastly, Costco keeps the actual price low, at equivalent to $5/month, so the membership fee really isn’t an impediment to most people who would shop at their stores, it just feels like it gives you exclusive access. It is not a major revenue driver for them, at roughly 2% of their total revenue, it is there mostly for the behavioral economic benefits Costco understands it imparts on people.
Costco’s strategy has led to an impressive, steady expansion in their returns over time. Uniform ROA rose from 8% in 2009 to 14% in 2019, as the company continues to see benefits from their focus. This is why the market pays a premium valuation for the firm, with a Uniform P/E of 35x, well above most retail peers.
However, at current premium valuations, the market may be too exuberant about Costco’s ability to continue to expand returns. Returns rose by 600bps in the past 10 years, and the market is currently pricing in 700bps of expansion in just the next 5 years.
While market expectations are high, management is showing concerns around sustaining membership growth rates, controlling costs and protecting margins, and around getting members to adopt tools like their app to continue to drive higher sales. With high expectations and risk to fundamentals, there may be risk to the stock.
Market expectations are for material Uniform ROA expansion, but management may be concerned about SG&A costs, membership growth, and app adoption
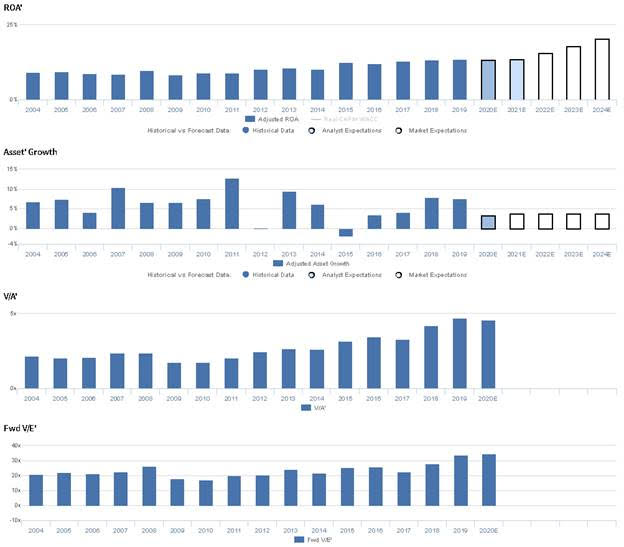
COST currently trades near historical highs relative to UAFRS-based (Uniform) Earnings, with a 34.4x Uniform P/E. At these levels, the market is pricing in expectations for Uniform ROA to expand from 14% in 2019 to a high of 21% in 2024, accompanied by 4% Uniform Asset growth going forward.
Meanwhile, analysts have less bullish expectations, projecting Uniform ROA to sustain 14% levels through 2021, accompanied by 3% Uniform Asset growth.
COST has seen historically stable profitability, with Uniform ROA remaining at 8%-11% levels from 2003 through 2014, before improving to 12%-14% levels from 2015 to 2019. Meanwhile, the firm has seen fairly consistent Uniform Asset growth, positive in 15 of the past 16 years, while ranging from -2% to 13%.
Performance Drivers – Sales, Margins, and Turns

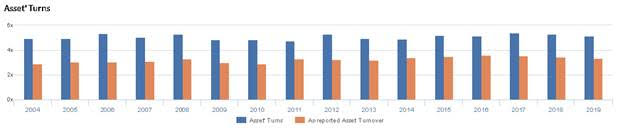
Trends in Uniform ROA have been driven by incremental improvements in Uniform Earnings Margin and stable Uniform Asset Turns. From 2003 to 2019, Uniform Margins improved from 2% to 3%. Meanwhile, Uniform Turns have ranged from 4.8x to 5.4x since 2003. At current levels, markets are pricing in expectations for further expansion in Uniform Margins, coupled with stability in Uniform Turns.
Earnings Call Forensics
Valens’ qualitative analysis of the firm’s Q4 2019 earnings call highlights that management may lack confidence in their ability to sustain average transaction growth, and they may be concerned about further increases to their SG&A costs. Furthermore, they may lack confidence in their ability to drive membership growth through promotions, and they may be overstating the inelasticity of their higher-end items. Finally, they may lack confidence in their ability to drive further adoption of their mobile app and realize cost savings through vertical integration.
UAFRS VS As-Reported
Uniform Accounting metrics also highlight a significantly different fundamental picture for COST than as-reported metrics reflect. As-reported metrics can lead investors to view a company to be dramatically stronger or weaker than real operating fundamentals highlight. Understanding where these distortions occur can help explain why market expectations for the company may be divergent.
As-reported metrics significantly understate COST’s asset utilization, one of the primary drivers of profitability. For example, as-reported asset turnover for COST was 3.4x in 2019, materially lower than Uniform Turns of 5.2x, making COST appear to be a much weaker business than real economic metrics highlight. Moreover, as-reported asset turns have been well below Uniform Turns in each year since 2003, significantly distorting the market’s perception of the firm’s performance for over a decade.
Today’s Tearsheet
Today’s tearsheet is for L’Oreal. L’Oreal trades at a significant premium to market average valuations. The company has recently had weak Uniform EPS growth, but is forecast for see stronger earnings growth for 2020-2021. At current valuations, the market is expecting the company to grow in line with analyst forecasts, implying the market may correctly understand L’Oreal’s fundamentals. The company’s earnings growth is above peer average levels, but the company is also trading above peer average valuations. The company has strong returns, with no risk to their dividend.
Regards,
Joel Litman
Chief Investment Strategist


