
Daniel Loeb of Third Point is putting a new strategy to the test

Earlier this year, a tiny hedge fund waged war on one of the biggest corporations in the world, and won. But it wasn’t the sort of war you’d expect a hedge fund to wage.
The giant activist Third Point took notes, and is trying the novel strategy for itself.
Read on to learn more about exactly what Daniel Loeb and his team at Third Point are doing, and see a detailed Uniform Accounting audit of the fund’s largest holdings.
Also below, a detailed Uniform Accounting tearsheet of the fund’s largest holding.
Investor Essentials Daily:
Friday Portfolio Review
Powered by Valens Research
Wall Street is nothing if not a world of copycats. When investors see something that works and is making money, they want to reproduce it before the alpha disappears to arbitrage.
This effect is especially true with shorter-term trading. Some traders such as the Najarian Brothers follow large options orders under the assumption that whomever placed them has more information, or that the order itself will trigger similar actions from other investors.
Algorithmic traders frequently use “momentum” to buy stocks as they rise and sell as they fall, attempting to time their entries and exits to beat the market.
But even giant activist funds are not above the copycat strategy.
Many took their initial learnings from players like Carl Icahn, attempting to big-stick-bully the companies they get involved with into doing what they believe will benefit their investment.
Players like Bill Ackman, who brought in a more collaborative approach, began to do well and spawned a generation of followers.
Daniel Loeb at Third Point, one of the most well-known activist funds in the world with $17 billion in assets under management, is following directly in the footsteps of another fund, but not just strategically. He is following it into a nearly identical trade.
In December last year, a tiny and virtually unknown hedge fund called Engine No. 1 took stake in Exxon Mobil (XOM). After a prolonged fight with the company’s directors, it managed to install three new board members.
The move wasn’t traditional Wall Street opportunism, however. Engine No. 1 is a new breed of investor focused heavily on environmental, social, and governance (“ESG”) factors. Its takeover at Exxon was executed with the explicit intention to realign the company to significantly reduce its carbon footprint.
All the while, Third Point was taking notes. And it is now pushing to do the same at Shell (RDS.A).
Third Point wants Shell to break itself up into two companies. One would isolate its traditional oil business, which is what we would call a “melting ice cube.” The other would put its renewables and liquified natural gas businesses under new management, free from the potentially perverse incentives of operating within a company that relies on fossil fuels, and hence emissions, to survive.
Unsurprisingly, just as Exxon had resisted Engine No. 1’s activism, Shell is pushing back. But by engaging Shell from an ESG perspective rather than a shareholder value creation, Third Point may be setting itself up to win allies it wouldn’t normally see. These include climate activism groups, regulators, and even longtime financial backers of Shell.
Now that Shell has reported an earnings dud, the Dutch pension fund ABP has announced a planned divestiture of its position in Shell under the premise that the firm isn’t doing enough to address climate change.
Similarly, when Engine No. 1 made its push into Exxon, longtime backers like Blackrock supported the activist. Usually, major institutional investors vehemently reject activist influence.
Third Point is hoping that if big money turns away from Shell, it might be forced to make drastic changes. Those who are invested during that inflection may stand to benefit enormously.
While this has been making waves recently, it isn’t the only activist campaign Third Point has. Let’s take a look at how its other holdings look through the lens of Uniform Accounting.
The below are the fifteen other companies that Daniel Loeb has chosen as top investments in the fund.
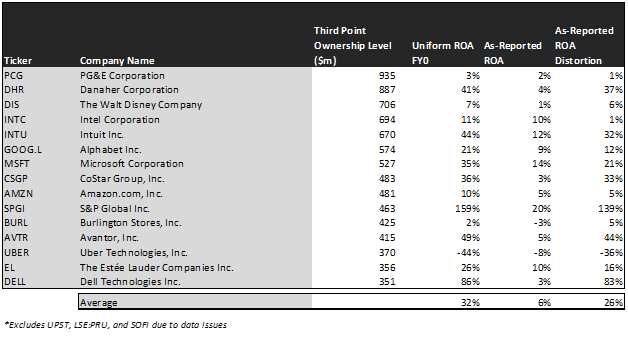
A distinct feature of Third Point’s investments is that they are far more profitable than they appear.
Because of distortions inherent to GAAP accounting rules, the return on assets (“ROA”) companies publish in their reports is often a false representation of how much value they actually deliver from their operations.
On an as-reported basis, these companies barely return above the cost of capital, at 6% ROA.
But once adjusting their financials to Uniform standards, we see that these companies generate robust profitability, with an average 32% Uniform ROA.
Take a look at Danaher Corporation (DHR), in which Third Point holds a larger position than it now does in Shell. But it wasn’t always one of the fund’s largest holdings. Loeb has held this position for years, and has watched it quadruple since investing six years ago.
While most investors would see a disappointing 4% ROA, those who embrace adjusted accounting see it be a fantastically productive healthcare equipment maker, with 41% Uniform ROA.
Similarly, take a look at S&P Global (SPGI). Most of the financial industry relies on datasets and information compiled by S&P on its Capital IQ platform, as it runs an asset-light operation with recurring revenue. As-reported ROAs of 20% fail to encompass how economically productive the company really is, with a Uniform ROA of 159%.
Finding companies that perform well is a common and important first step in investing, but it does not hold the key to finding alpha.
Investors need to find those companies that perform well, but are priced to perform poorly. Without the visibility of Uniform Accounting, this may be difficult to quantify. But thanks to our team’s Embedded Expectations Analysis, we can see exactly what a company is priced to do.
The chart below compares analyst-expected returns with market-expected returns. When there is a severe dislocation between the two, it can often mean the market is failing to understand something about a company. See for yourself:
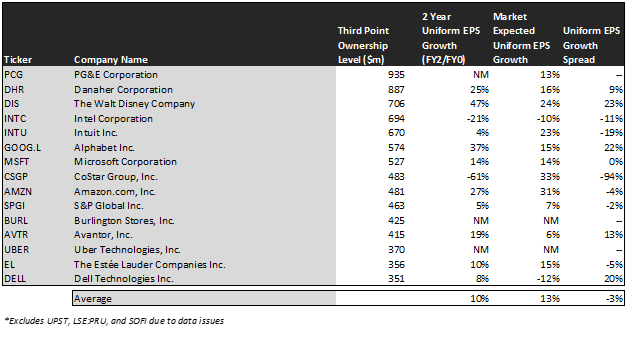
This chart shows three interesting data points:
- The 2-year Uniform EPS growth represents what Uniform earnings growth is forecast to be over the next two years. The EPS number used is the value of when we take consensus Wall Street estimates and we convert them to the Uniform Accounting framework.
- The market expected Uniform EPS growth is what the market thinks Uniform earnings growth is going to be for the next two years. Here, we show by how much the company needs to grow Uniform earnings in the next 2 years to justify the current stock price of the company. If you’ve been reading our daily analyses and reports for a while, you’ll be familiar with the term embedded expectations. This is the market’s embedded expectations for Uniform earnings growth.
- The Uniform EPS growth spread is the spread between how much the company’s Uniform earnings could grow if the Uniform earnings estimates are right, and what the market expects Uniform earnings growth to be.
Wall Street analysts, who spend every day studying market conditions and management initiatives for the companies they specialize in, believe this portfolio is set up to grow its EPS by 10% over the next two years.
The market has fairly similar expectations, pricing these companies to grow their EPS by 13% over the same period.
This shows one of two things. Either the companies Loeb holds are slightly overvalued relative to analyst expectations and hence may provide little incremental upside, or analysts aren’t fully appreciating his activist influence.
Take a look at CoStar Group (CSGP), for example. The real estate data and analytics company is expected to face a decline in EPS to the tune of 61% over the next two years. The market, however, thinks that it will continue to expand its profitability.
However, Third Point also holds Alphabet (GOOG.L), the parent company to Google. While the market has priced Alphabet to grow its earnings by 15%, analysts are expecting a sharper improvement by 37%. Sometimes, even the largest and most covered companies can see significant dislocations in market and analyst expectations.
Overall, Third Point holds profitable companies that are, on average, reasonably priced. We must remember that Loeb’s activist strategies could surprise analysts as well as the market. This is the lever he can pull to extract alpha.
But every investor has a lever to pull, some more effective than others. Some investors choose the growth route, caring little for valuations. Others can day-trade the charts.
Embedded Expectations Analysis is a powerful tool that has worked for the team here at Valens, as the top ten highlight picks on our Conviction Long List have historically beat the market by 13%.
See how the research process here at Valens can put you ahead of the market. Learn more about getting access to the Conviction Long List here, or our quantitative list, the QGV 50, here.
Read on to see a detailed tearsheet of Third Point’s largest holding.
SUMMARY and PG&E Corporation Tearsheet
As Third Point’s largest individual stock holdings, we’re highlighting PG&E’s tearsheet today.
As the Uniform Accounting tearsheet for PG&E Corporation (PCG:USA) highlights, its Uniform P/E trades at a negative Uniform P/E, which is below the global corporate average of 24.3x and its pre-2021 average of 33.6x.
High P/Es require high EPS growth to sustain them. In the case of PG&E, which has recorded higher P/Es on average, the company has recently shown an 80% Uniform EPS shrinkage.
Wall Street analysts provide stock and valuation recommendations that, in general, provide very poor guidance or insight. However, Wall Street analysts’ near-term earnings forecasts tend to have relevant information.
We take Wall Street forecasts for GAAP earnings and convert them to Uniform earnings forecasts. When we do this, PG&E’s Wall Street analyst-driven forecast is for EPS to shrink by 219% in 2021 and by 72% in 2022.
Based on the current stock market valuations, we can use earnings growth valuation metrics to back into the required growth rate to justify PG&E’s $12 stock price. These are often referred to as market embedded expectations.
The company is currently being valued as if Uniform earnings were to grow by 13% annually over the next three years. What Wall Street analysts expect for PG&E’s earnings growth is below what the current stock market valuation requires in 2021 and 2022.
Meanwhile, the company’s earning power is below the long-run corporate averages. Moreover, cash flows and cash on hand consistently fall short of its total obligations—including debt maturities, capex maintenance, and dividends. Moreover, PG&E’s intrinsic credit risk is 110 bps above the risk free rate. Together, these signal moderate operating and credit risks.
Lastly, PG&E’s Uniform earnings growth is below peer averages. As such, the company is trading below its average peer valuations.
Best regards,
Joel Litman & Rob Spivey
Chief Investment Strategist &
Director of Research
at Valens Research