
When David Tepper speaks, the market listens, and you should pay attention

David Tepper can move the markets with a single sentence. His reputation for predicting macroeconomic trends precedes him, and investors would be foolish not to pay attention to what he has to say.
His latest call may be of particular importance to those betting on equities. Read on to learn about what made Tepper a legend in the hedge fund universe, and what he has to say about the market right now.
Also below, a detailed tearsheet of one of his favorite stocks.
Investor Essentials Daily:
Friday Uniform Portfolio Analytics
Powered by Valens Research
While a lot of investors appear on CNBC and Bloomberg and Fox Business News regularly, few of them have the ability to consistently move the market as David Tepper does.
Tepper has consistently made prescient calls about the market through the years. His strategy was simple: Buy the debt of companies on the brink of bankruptcy, but with conviction that these companies can claw their way out of their distressed state.
When the junk bond market crashed in 1989, Tepper bought a slew of distressed debt. The trade made his employer at the time, Goldman Sachs, massive gains. Some even say it was Tepper who put Goldman Sachs on the path to become one of the most dominant firms in Wall Street history.
But after Goldman refused to promote Tepper to partner, he left to start Appaloosa Management. His strategy stayed true, but his scope increased. Like Elliott Management’s Paul Singer, Tepper found success in buying government bonds of countries suffering from economic collapse throughout the 1990s.
Then, in 2008, a fantastic opportunity presented itself to Tepper on a silver platter. As shares of financial institutions like Bank of America plummeted to pennies on the dollar of what they had been worth months earlier, Tepper bought all he could.
His bet that these institutions would eventually recover paid off immensely, earning his fund $7 billion in 2009, $4 billion of which was personal profit. He was the most successful investor of the financial crisis, making Micheal Burry’s success seem like child’s play in comparison.
His successes continued when he correctly predicted that Trump’s tax cuts would push the market to all-time highs in 2017-2018, and how the coronavirus would impact the market in 2020.
The same investment themes that worked during the pandemic are losing steam. How should you be positioning your portfolio heading into 2022? Tune into our 2022 prospective webinar to learn more about our top ideas for next year. Click here to register.
Part of the reason Tepper keeps getting things right is he has a healthy respect for macroeconomic signals. His reputation has afforded him his market-moving opinions.
In late October on CNBC, he said that due to his expectations for inflation and interest rates, he doesn’t think that stocks or bonds are particularly interesting, while exposing himself more to commodities. This call comes amid a period of elevated commodity prices and volatility, with each week seemingly bringing yet another commodity suddenly appreciating by 50% or more.
Let’s dive into the equity portion of his portfolio to see what Uniform Accounting can tell us about the stocks he chooses to hold onto amid this period of high rates, inflation, and market uncertainty.
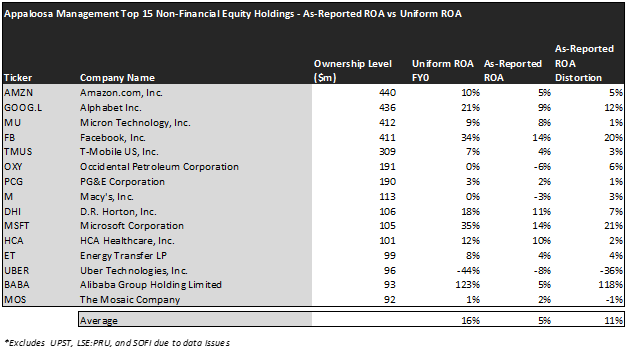
On an as-reported basis, Tepper’s portfolio appears lackluster, with a 5% return on assets (“ROA”). But there are a number of companies in his fold that fall victim to GAAP distortions that substantially change the story.
Our team looks for over 130 adjustments to the financial statements to deliver metrics that actually represent the economic productivity of companies. Once these adjustments are made, Appaloosa’s holdings shape up to be stronger performers, with a 16% weighted average Uniform ROA.
For example, take a look at Tepper’s largest holding, Amazon (AMZN). Because GAAP counts R&D spending as an annual expense rather than an investment into future cash flows, Amazon’s re-investment strategy can make it seem like a business with poor profitability.
Uniform Accounting treats R&D more fairly to its intended purpose, a depreciating investment. This, along with several other material adjustments, bring Amazon’s real Uniform ROA up to 10%. That is a significant change for a company that holds so many physical assets.
It should be noted that Tepper’s portfolio holds a number of names performing below the cost of capital even on a Uniform basis. That includes Occidental Petroleum (OXY), PG&E (PCG), Macy’s (M), Uber (UBER), and The Mosaic Company (MOS). While he may be hoping for performance turnarounds for Macy’s and Uber, his portfolio may continue to be weighed down by the industrial, utility, and O&G names he holds.
But investors need to remember… Finding companies that perform well is a common and important first step in investing, but it does not hold the key to finding alpha.
Investors need to find those companies that perform well, but are priced to perform poorly. Without the visibility of Uniform Accounting, this may be difficult to quantify. But thanks to our team’s Embedded Expectations Analysis, we can see exactly what a company is priced to do.
The chart below compares analyst-expected returns with market-expected returns. When there is a severe dislocation between the two, it can often mean the market is failing to understand something about a company. See for yourself:

This chart shows three interesting data points:
- The 2-year Uniform EPS growth represents what Uniform earnings growth is forecast to be over the next two years. The EPS number used is the value of when we take consensus Wall Street estimates and we convert them to the Uniform Accounting framework.
- The market expected Uniform EPS growth is what the market thinks Uniform earnings growth is going to be for the next two years. Here, we show by how much the company needs to grow Uniform earnings in the next 2 years to justify the current stock price of the company. If you’ve been reading our daily analyses and reports for a while, you’ll be familiar with the term embedded expectations. This is the market’s embedded expectations for Uniform earnings growth.
- The Uniform EPS growth spread is the spread between how much the company’s Uniform earnings could grow if the Uniform earnings estimates are right, and what the market expects Uniform earnings growth to be.
Based on the present valuations of these companies, we can see that the market has an embedded expectation for 5% EPS growth over the next two years.
Analysts, however, are even more bullish. They expect these companies to grow their EPS by 21% per year over the next two years.
This sets investors up favorably, as these analysts have better visibility into what the companies they cover are really doing. If the market has embedded worse expectations than analysts, these stocks could be set up for a wave of upside surprises as analyst expectations come to fruition.
For example, take a look at Tepper’s second largest holding, Alphabet (GOOGL). Despite the lofty valuation that Google already commands, analysts think the company has more potential to grow its earnings base than the market realizes. While the market expects 15% Uniform EPS growth, analysts expect the company to more than double that growth to 37%.
Similarly, take a look at D.R. Horton (DHI), a large homebuilder. While the market has priced the company to become less profitable over the next two years, shrinking its Uniform EPS by 11%, analysts expect the opposite. They recognize the impressive backlog D.R. Horton has amassed over the past year, expecting the company to grow its Uniform EPS by 43%.
Want to make sure you’re invested in the right companies heading into 2022? Don’t forget to tune into our 2022 market prospective webinar on November 18th at 12pm ET. We’ll be covering everything you need to know to confidently invest to beat the market next year.
Overall, Tepper is taking a more conservative approach to his current equity investments than he may be known for. While several of these names fall into his favorite category of “distressed equities,” like Macy’s and Energy Transfer (ET), many are mega-cap technology companies or growth names that he intends to hold for many years.
This may speak to what Tepper has been saying recently: Equities don’t look particularly attractive at the moment. When asked if he likes the stock market right now, he said he likes it as a long-term investor, but not as a trader.
Said otherwise, short-term opportunities are more difficult to come by.
This reflects our own analysis of the macroeconomic environment. We have been telling our institutional clients to expect a period of sideways trading near all-time highs.
However, we have identified a number of names that we think are poised to grow by upwards of 50% over the next few years. These companies are experiencing a unique blend of industry tailwinds and smart management initiatives that can help them buck a sideways market.
Learn more about our Conviction Long List here.
Read on to see a detailed tearsheet of one of Tepper’s favorite companies.
SUMMARY and Micron Technology, Inc. Tearsheet
As one of Appaloosa’s largest individual stock holdings, we’re highlighting Micron Technology’s tearsheet today.
As our Uniform Accounting tearsheet for Micron Technology, Inc. (MU:USA) highlights, its Uniform P/E trades at 9.5x, which is below the global corporate average of 24.3x and its own historical average of 13.8x.
Low P/Es require low EPS growth to sustain them. In the case of Micron, the company has recently shown a 217% Uniform EPS growth.
Wall Street analysts provide stock and valuation recommendations that, in general, provide very poor guidance or insight. However, Wall Street analysts’ near-term earnings forecasts tend to have relevant information.
We take Wall Street forecasts for GAAP earnings and convert them to Uniform earnings forecasts. When we do this, Micron’s Wall Street analyst-driven forecast is for EPS to grow by 53% and 27% in 2022 and 2023, respectively.
Based on the current stock market valuations, we can use earnings growth valuation metrics to back into the required growth rate to justify Micron’s $73 stock price. These are often referred to as market embedded expectations.
The company is currently being valued as if Uniform earnings were to shrink by 8% annually over the next three years. What Wall Street analysts expect for Micron’s earnings growth is above what the current stock market valuation requires through 2023.
Meanwhile, the company’s earning power is 2x long-run corporate averages. Furthermore, cash flows and cash on hand consistently exceed total obligations—including debt maturities, capex maintenance, and dividends. Moreover, intrinsic credit risk is just 20 bps. Together, these signal low credit and dividend risks.
Lastly, Micron’s Uniform earnings growth is above peer averages, but the company is trading below its average peer valuations.
Best regards,
Joel Litman & Rob Spivey
Chief Investment Strategist &
Director of Research
at Valens Research