
This company is being priced as an ATM business, but there’s likely more than meets the eye

As the demand for cash has declined over the years, many investors suspect businesses involved in the ATM space are doomed for disaster.
While today’s company is being priced like any other ATM company, it may have a trick up its sleeve.
Also below, the company’s Uniform Accounting Performance and Valuation Tearsheet.
Investor Essentials Daily:
Tuesday Tearsheets
Powered by Valens Research
Many trends slowly developing over the past 10 or 20 years have been pushed into overdrive by the quarantine.
One trend the pandemic has helped catalyze is the death of cash, a trend that has been building since the adoption of the credit card.
The penetration of easier payment methods such as credit cards, online payment systems, and person-to-person money transfers amongst others has been eating away at the need for physical cash in developed countries.
Consequently, individuals may expect a company in the ATM business to be facing secular headwinds. For the ATM company Diebold Nixdorf (DBD), investors do not have high hopes.
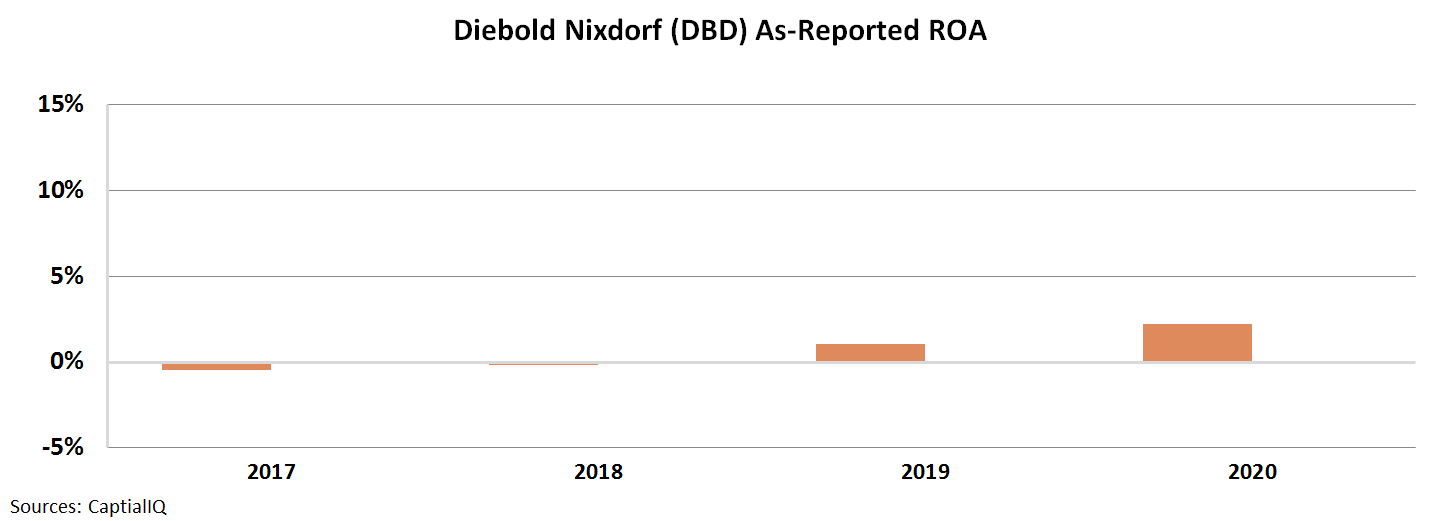
This is why it makes sense to investors that the company’s as-reported return on assets (ROA) have hovered near 0% levels over the past four years.
Specifically, ROA was negative in 2017 and 2018, before inflecting slightly positively to 2% in 2020. This is still well below cost of capital, let alone the corporate average.
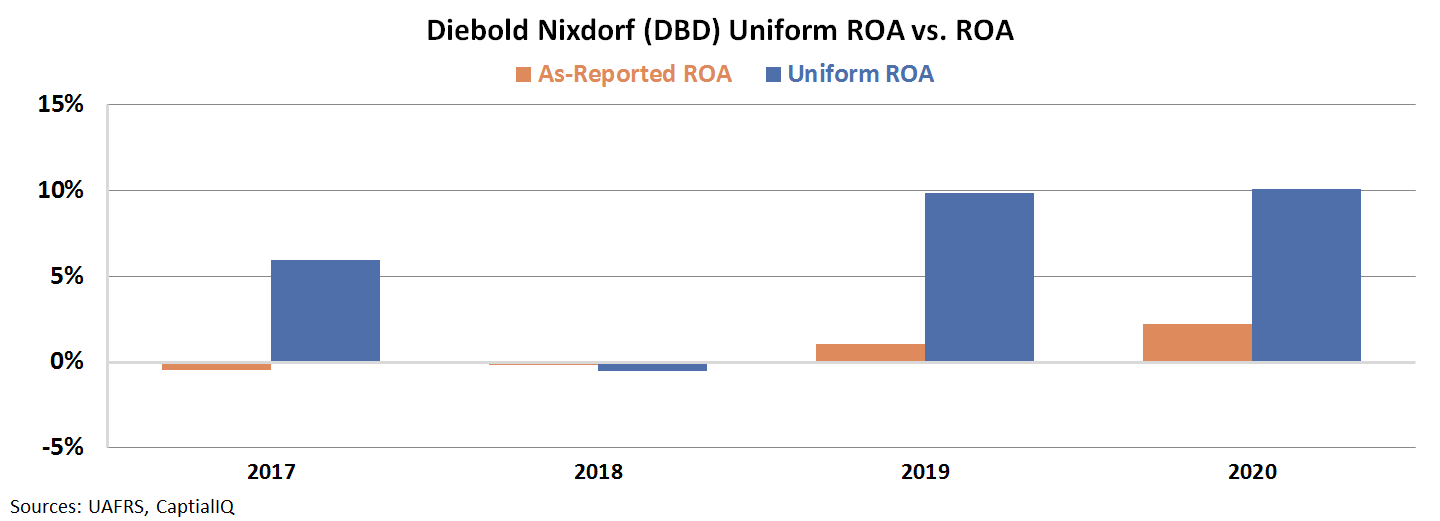
In reality, this is not an accurate picture of Diebold’s profitability
The company is not a below cost-of-capital business. In fact, its true profitability levels are more in line with the current corporate average of 12%.
Specifically, Uniform ROA levels have expanded from 6% in 2017 to 10% in 2020.
While many believe the demand for cash is dying and that any business involved in ATMs is struggling, Diebold’s ROA levels indicate otherwise.
This is because Diebold’s business model goes well beyond ATMs. It also provides services such as check out solutions, which reduce the need for employee customer interactions for retail shoppers.
This has become increasingly important given the health precautions throughout the pandemic and will continue to be prevalent exiting the pandemic.
This part of its business alone hedges the business from the decline of cash.
One of the company’s key areas of focus over the past several years has been the creations of its Vynamic Payments solution.
This segment is a cloud-based payment processing platform that enables both retailers and banks to leverage a new integrated payment back end.
The platform is a large growth driver within the business and it also allows it to sell analytical insights and managed services solutions to banks.
As depicted, the company has moved away from being a Point of Sale and ATM business to more of a payment processing franchise over the years.
To gain a greater understanding about what the market is pricing in, we can use our Embedded Expectations Framework.
Most investors determine stock valuations using a discounted cash flow (DCF) model, which takes assumptions about the future and produces the “intrinsic value” of the stock.
However, here at Valens we know models with garbage-in assumptions only come out as garbage. Therefore, we’ve turned the DCF model on its head with our Embedded Expectations Framework. Here, we use the current stock price to determine what returns the market expects.
In the chart below, the dark blue bars represent Diebold’s historical corporate performance levels in terms of ROA. The light blue bars are Wall Street analysts’ expectations for the next two years. Finally, the white bars are the market’s expectations for how the company’s ROA will shift in the next five years.
Wall Street analysts are expecting Diebold’s Uniform ROA to expand further to 26% levels by 2022.
Despite this forecasted growth, the market is pricing in Uniform ROA to maintain 10% levels by 2025.
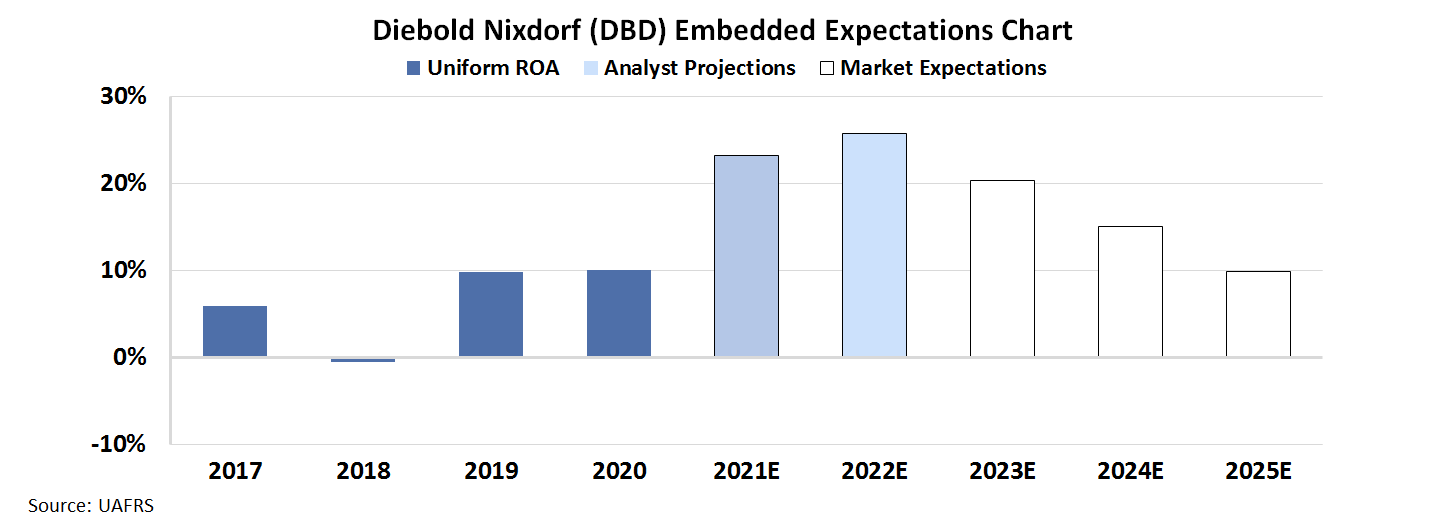
If Diebold Nixdorf continues to execute on its transition away from ATMs and to a more dynamic payment processing company, these expectations may be too bearish.
This is another case of how Uniform ROA is able to peel back the truth of a company and show savvy investors where the wider market may be led astray.
SUMMARY and Diebold Nixdorf, Incorporated Tearsheet
As the Uniform Accounting tearsheet for Diebold Nixdorf, Incorporated (DBD:USA) highlights, the Uniform P/E trades at 9.2x, which is below the global corporate average of 23.7x and its own historical average of 13.2x.
Low P/Es require low EPS growth to sustain them. In the case of Diebold Nixdorf, the company has recently shown a 1,123% Uniform EPS decline.
Wall Street analysts provide stock and valuation recommendations that in general provide very poor guidance or insight. However, Wall Street analysts’ near-term earnings forecasts tend to have relevant information.
We take Wall Street forecasts for GAAP earnings and convert them to Uniform earnings forecasts. When we do this, Diebold Nixdorf’s Wall Street analyst-driven forecast is a 256% EPS decline in 2021, followed by a 31% EPS growth in 2022.
Based on the current stock market valuations, we can use earnings growth valuation metrics to back into the required growth rate to justify Diebold Nixdorf’s $15 stock price. These are often referred to as market embedded expectations.
The company is currently being valued as if Uniform earnings were to have no growth over the next three years. What Wall Street analysts expect for Diebold Nixdorf’s earnings growth is below what the current stock market valuation requires in 2021 but above its requirement in 2022.
Furthermore, the company’s earning power is twice the long-run corporate average. Also, intrinsic credit risk is 880bps above the risk-free rate and cash flows and cash on hand are below its total obligations—including debt maturities, capex maintenance, and dividends. All in all, this signals a high dividend and credit risk.
To conclude, Diebold Nixdorf’s Uniform earnings growth is below its peer averages, and the company is also trading below average peer valuations.
Best regards,
Joel Litman & Rob Spivey
Chief Investment Strategist &
Director of Research
at Valens Research


