
Despite only being at the helm for 9 months, a railroad visionary changed this company’s operations and improved profitability

Today’s company benefits from the presence of an industry-leading visionary changing its operational strategy. Despite only being at the helm for 9 months, he transformed this firm’s operations using a strategy that has worked for him across the industry.
As-reported metrics would have you believe this company’s returns have only grown slightly, but true UAFRS (Uniform) based analysis shows the firm’s real profitability.
Also below, Uniform Accounting Embedded Expectations Analysis and the Uniform Accounting Performance and Valuation Tearsheet for the company.
Investor Essentials Daily:
Tuesday Tearsheets
Powered by Valens Research
Industries that have been around for over 130 years tend to not be suddenly disrupted. The largest innovations have generally already occured, and each incremental disruption is, for the most part, smaller and smaller.
People often rave about Tesla (TSLA) changing the world of cars, despite the electric vehicle being invented in 1881. The concept has been around since the very first cars, and other companies have worked on hybrid and fully electric vehicles long before Tesla.
Tesla isn’t revolutionizing an industry, it is working to make the electric vehicle cost effective enough for mass production through incremental improvements on the design.
However, railroad executive Hunter Harrison was exactly the type of person to buck this trend. His journey through the railroad industry is a list of the who’s-who of railroads—from Illinois Central to Canadian National (CNI), Canadian Pacific (CP), and onto CSX (CSX).
Harrison focused relentlessly on improving railroad “efficiency” at each company he worked for. Efficiency in the railroad industry means maximizing revenues from a railroad’s assets.
Harrison implemented a system called Precision Scheduled Railroading (PSR), which is an operational method designed to maximize railroad efficiency. It focuses on freight movements for the individual carload rather than the entire train. This allows for more direct point-to-point routing, flexibility, and the bypassing of classification terminals.
PSR does not come without controversy however, as it has a penchant for cutting expenses and reducing headcount. Harrison cut over 3,700 jobs while implementing PSR.
Harrison implemented this method across all of the companies he ran. Harrison was lured away from Canadian National (CNI) in 2011 by Bill Ackman of hedge fund Pershing Square Holdings (PSH). Ackman waged an activist campaign against Canadian Pacific, eventually winning and appointing Harrison to the helm. He revolutionized the company’s performance, turning it around.
Eventually, Harrison left Canadian National in 2017 to lead U.S. competitor CSX Corporation after another activist battle.
Unfortunately, Harrison passed away in 2017, after nine months with the company. That being said, in this short time, he was able to begin implementation of his PSR efficiency system and make other structural changes.
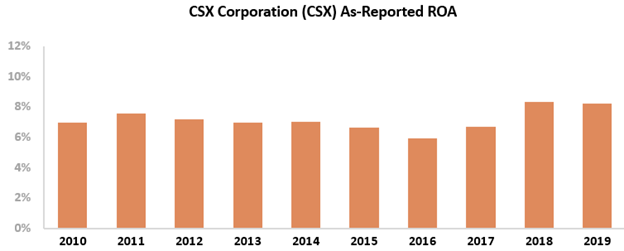
However, looking at as-reported metrics, it appears these changes have only resulted in modest improvements. As-reported return on assets (ROA) has grown from 6% in 2016 to 8% in 2019. Maybe Harrison did not have time to fully implement his system.
However, this picture of CSX’s performance is not accurate. This is due to distortions in as-reported accounting, including the treatment of operating leases and PP&E, among other distortions. The market has missed the mark about the strength of returns.
CSX’s Uniform ROA rose significantly from 6% to 10% during the year Harrison was at the helm. Uniform ROA was 10% in 2019, compared to 8% as-reported ROA.
CSX has been able to effectively implement the PSR system, as evidenced by the recent inflection of returns in an industry many consider to be in stagnation.

However, understanding how returns have recently inflected does not explain if the stock is undervalued or overvalued.
To understand if the firm can continue to create value for shareholders, we can use the Embedded Expectations Framework to easily understand market valuations.
The chart below explains the company’s historical corporate performance levels, in terms of ROA (dark blue bars) versus what sell-side analysts think the company is going to do in the next two years (light blue bars) and what the market is pricing in at current valuations (white bars).
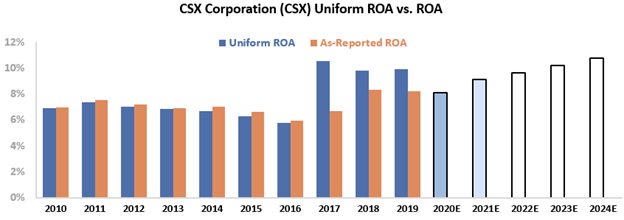
Analysts forecast returns to drop from 10% to 9%, while the market is pricing in returns to grow to 11%, matching all-time highs seen under Harrison in 2017.
If CSX is unable to improve efficiency to drive higher returns, these expectations may be too optimistic. Not to mention, nearly 20% of CSX’s freight is coal, an industry in secular decline.
The railroad industry continues to slash headcount, falling below 200,000 employees for the first time since the Labor Department began keeping track in the 1940s. Unless CSX can hire another visionary like Harrison, these headwinds may be too much to overcome to reach the market’s expectations.
Without Uniform Accounting, investors would miss the extent of the inflection of returns for this railroad company. They might see CSX as a firm that saw a slight bump in profitability after Harrison took over and not one with robust profitability gains.
The market is pricing in returns to grow to all-time highs. If CSX cannot innovate to avoid the shrinking railroad and coal industry, these expectations may be too high.
CSX Corporation Embedded Expectations Analysis – Market expectations are Uniform ROA to remain stable, but management may have concerns about volumes, costs, and locomotives

CSX currently trades near corporate averages relative to Uniform earnings, with a 23.8x Uniform P/E (Fwd V/E’). At these levels, the market is pricing in expectations for Uniform ROA to improve slightly to 11% through 2024, accompanied by immaterial Uniform asset shrinkage going forward.
Meanwhile, analysts have similar expectations, projecting Uniform ROA to maintain 9%-10% levels through 2021, accompanied by 2% Uniform asset shrinkage.
Historically, CSX has seen somewhat cyclical, yet generally improving profitability. Uniform ROA expanded from 3% in 2004 to 6% levels from 2006-2008, before contracting to 5% in 2009, amidst recessionary headwinds. Then, after rebounding to 7% levels in 2010-2014, Uniform ROA faded back to 6% levels in 2015-2016, before jumping to 10%-11% levels in 2018-2019.
Meanwhile, Uniform asset growth has been generally muted, yet volatile, positive in ten of the past sixteen years, while ranging from -2% to 5%, excluding 19% outperformance in 2004.
Performance Drivers – Sales, Margins, and Turns
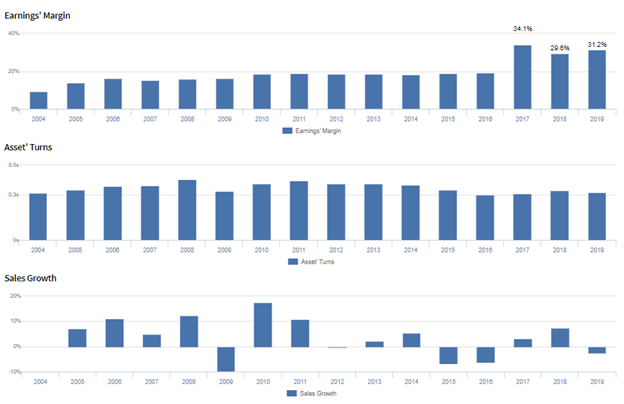
Improvements in Uniform ROA have been driven primarily by improving Uniform earnings margins, coupled with stable Uniform asset turns.
After gradually expanding from 9% in 2004 to 18%-19% levels from 2010-2016, Uniform margins jumped to a peak of 31% in 2019. Meanwhile, since 2004, Uniform asset turns have ranged from 0.3x-0.4x through 2019.
At current valuations, the market is pricing in expectations for Uniform margins to remain near current levels, accompanied by continued stability in Uniform turns.
Earnings Call Forensics
Valens’ qualitative analysis of the firm’s Q2 2020 earnings call highlights that management may have concerns about the sustainability of customer volume, returns from their assets, and the continued increase in costs, particularly in depreciation and union wages.
However, they may have concerns about the impact of coronavirus on their results, their current cash balance, and international volume declines due to a lackluster Chinese New Year and extended shutdowns in China.
In addition, they may lack confidence in their ability to work with customers as they reopen their businesses, reduce depreciation expense in the near-term, and run their network at maximum efficiency.
Furthermore, they may be exaggerating their business resiliency, their ability to attract new rail shippers, and the progress of their coronavirus-driven business adjustments.
Moreover, they may lack confidence in their ability to sustain merchandise revenue growth, maintain carload share gains, and continue to execute in the construction aggregate business.
Additionally, they may be concerned about continued difficulty competing in the e-commerce space, their real estate operations, and the merchandise supply chain.
Finally, they may lack confidence in their ability to reduce labor headcount and manage slow declines in auto industry volume, and they may have concerns about lower equipment rents due to lower earnings from their TTX affiliate.
UAFRS VS As-Reported

Uniform Accounting metrics also highlight a significantly different fundamental picture for CSX than as-reported metrics reflect.
As-reported metrics can lead investors to view a company to be dramatically stronger or weaker than real operating fundamentals highlight. Understanding where these distortions occur can help explain why market expectations for the company may be divergent.
As-reported metrics significantly overstate CSX’s margins, one of the key drivers of profitability.
For example, as-reported EBITDA margin for CSX was 53% in 2019, materially higher than Uniform earnings margin of 31% in the same year, making CSX appear to be a much stronger business than real economic metrics highlight.
Moreover, since 2004, as-reported EBITDA margin has been stronger compared to Uniform margins, significantly distorting the market’s perception of the firm’s historical profitability trends.
SUMMARY and CSX Corporation Tearsheet
As the Uniform Accounting tearsheet for CSX Corporation (CSX:USA) highlights, the Uniform P/E trades at 23.8x, which is around the global corporate average, but above its historical average valuations.
Average P/Es require average EPS growth to sustain them. In the case of CSX, the company has recently shown an 8% growth in Uniform EPS.
Wall Street analysts provide stock and valuation recommendations that in general provide very poor guidance or insight. However, Wall Street analysts’ near-term earnings forecasts tend to have relevant information.
We take Wall Street forecasts for GAAP earnings and convert them to Uniform earnings forecasts. When we do this, CSX’s Wall Street analyst-driven forecast an EPS decline of 19% in 2020, followed by an EPS growth of 19% in 2021
Based on the current stock market valuations, we can use earnings growth valuation metrics to back into the required growth rate to justify CSX’s $78 stock price. These are often referred to as market embedded expectations.
In order to justify current stock prices, the company would need to have Uniform earnings immaterially grow annually over the next three years. What Wall Street analysts expect for CSX’s earnings growth is below what the current stock market valuation requires in 2020, but above its requirement in 2021.
Furthermore, the company’s earning power is 2x corporate average. Also, cash flows and cash on hand are above their total obligations—including debt maturities, capex maintenance, and dividends. Together, this signals low credit and dividend risk.
To conclude, CSX’s Uniform earnings growth is below peer averages, but the company is trading in line with its average peer valuations.
Best regards,
Joel Litman & Rob Spivey
Chief Investment Strategist &
Director of Research
at Valens Research


