
Many utilities see profits decline when they try to shrink their carbon footprint, UAFRS shows this firm has improved return using renewable energy

Many utilities have struggled to reduce their carbon footprint without sacrificing profitability, and this firm has shown that renewable energy can lead to higher returns.
Although its profitability has improved, this firm’s stock has underperformed its sector. Below we look at whether that’s reasonable and what to expect for the company going forward.
Also below, Uniform Accounting Embedded Expectations Analysis and the Uniform Accounting Performance and Valuation Tearsheet for the company.
Investor Essentials Daily:
Thursday Tearsheets
Powered by Valens Research
The Paris Agreement of 2015 marked a monumental milestone for climate change.
About 190 nations came together to develop a plan to mitigate the impact of global warming. The member nations would work to set individual emissions targets and regularly report the progress of their greenhouse-gas reduction efforts.
Although the US has since announced its intentions to leave the agreement, many state governments and corporations have taken the call to action. They have instituted policies to reduce their carbon footprint.
Among the largest targets for emission reductions have been power plants. The electricity production industry is estimated to be the second largest emitter of greenhouse gasses. It makes up around 28% of the United States’ total emissions.
Over the past few years, many utility companies have worked to reduce their footprint by shifting production from coal power plants to lower emission natural gas power plants. Natural gas is still a large emitter, but this move marks a step in the right direction.
This may not seem like that big of a deal, but many nonprofits are concerned it could mean their domain costs are about to skyrocket.
The obvious long-term goal is to transition further from natural gas to renewable options such as solar, wind, and hydro. However, this technology can still be somewhat nascent, and it will take time to scale these sources enough to meet electricity demands.
Some utility firms, such as Entergy Corporation (ETR), which operates primarily in the Southern US, have dove headfirst into this initiative. Since its transition, Entergy has seen profitability decline significantly, at least in the near-term.

Its profitability declines have been driven by a compression in asset utilization. This is expected, as renewable plants don’t consistently produce power. For instance, solar energy requires sunlight. Wind energy requires it to be windy.
As a result, the firm would expect to see lower revenue per dollar of investment, especially since power plants require large upfront investments.

The expectation for Entergy, and other utilities, is that they would be able to make up for this decline in asset efficiency with improved margins. Renewable energy does not require additional input costs. However, for some, such as Entergy, this has not happened.
That said, other firms such as Duke Energy Corporation (DUK), which operates largely in the Southeast, have also turned to renewables, hoping for a different result.
Duke Energy has invested heavily in renewables initiatives, setting a goal of having 14% of its power come from renewables by 2025. This is almost a threefold increase from the 5% it had in 2018.
Based on as-reported metrics, it may seem like Duke Energy is following the same fate as Entergy. The move to renewables, and other operational issues seem to be pressuring the firm’s returns as as-reported ROA has been compressing in each year since 2016.
The market appears to recognize this downtrend as DUK has underperformed the utilities industry sector (XLU) significantly since 2016. XLU has been up by over 40%. DUK has only increased by 24%.

However, in reality, Duke Energy has not seen declining returns as the firm has been investing. Returns have been ramping higher, increasing from 3% in 2016 to 4% in 2019.
Duke Energy has been able to achieve this by doing what Entergy has so far struggled to. While keeping asset turnover relatively flat, Duke Energy has greatly expanded its margins, particularly in recent years, rising from 16% in 2016 to 20% in 2019.
That being said, despite underperformance against its industry, Duke Energy’s market expectations still aren’t overly pessimistic. At current levels, the market projects Uniform ROA to expand to historical peaks of 6%, accompanied by 2% Uniform aset growth.
Considering the firm’s weak historical profitability and strict industry regulations, it seems that the market is already pricing in a near-best case scenario for the firm. Duke Energy would have to execute well on its renewable energy initiatives to justify current valuations.
To add, management appears concerned about their execution of pipeline projects and potential negative legislation changes, which indicates that the firm may face near-term headwinds.
As such, it may be difficult to the firm to meet high expectations, even if it can fully embrace and integrate renewable energy.
Duke Energy Corporation Embedded Expectations Analysis – Market Expectations are for peak Uniform ROA, but management may be concerned about their Atlantic Coast Pipeline, legislation, and net income
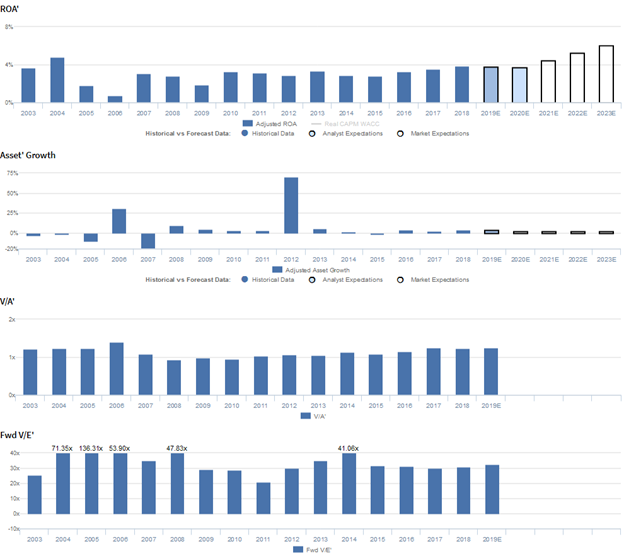
DUK currently trades at the high end of recent valuations relative to Uniform Assets, with a 1.2x Uniform P/B (V/A′).
At these levels, the market is pricing in expectations for Uniform ROA to improve from 4% levels in 2019 to 6% by 2024, accompanied by 2% Uniform Asset growth going forward. However, analysts have more muted expectations, projecting Uniform ROA to remain at 4% levels through 2021, accompanied by 2% Uniform Asset growth.
Historically, DUK has seen somewhat stable profitability, near cost-of-capital levels. Uniform ROA collapsed from 5% in 2004 to just 1% in 2006. However, following the acquisition of Cinergy in 2006, Uniform ROA stabilized at 3% levels from 2007 to 2016, excluding 2% underperformance in 2009, driven by recessionary headwinds.
Since then, Uniform ROA has expanded to 4% in 2017-2019. Meanwhile, Uniform Asset growth has been fairly volatile, positive in 11 of the past 16 years while ranging from -19% to 15%, excluding 32% growth in 2006 from the aforementioned acquisition, and 51% growth in 2012 from a merger with Progress Energy.
Performance Drivers – Sales, Margins, and Turns
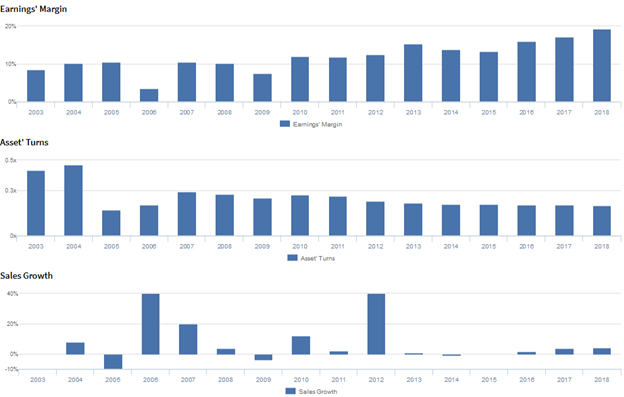
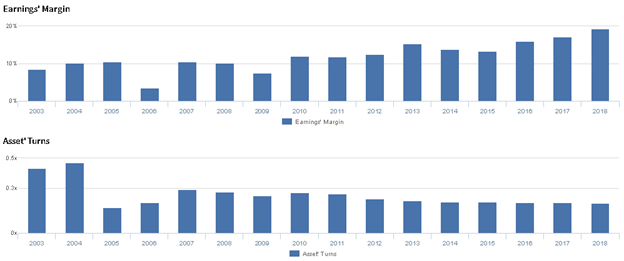
Stable Uniform ROA has been driven by offsetting trends in Uniform Earnings Margin and Uniform Asset Turns.
After stabilizing at 10%-11% in 2004-2005, Uniform Earnings Margin dropped to 3% in 2006, before recovering to 11% in 2007. Since then, Uniform Earnings Margin has gradually improved to current 20% peaks in 2019, excluding 8% underperformance in 2009.
Meanwhile, Uniform Turns dropped to just 0.2x in 2005, before recovering to 0.3x in 2007. Since then, Uniform Turns have faded back to 0.2x levels since 2012.
At current valuations, the market is pricing in expectations for Uniform Margins to expand to peak levels, coupled with a recovery in Uniform Turns.
Earnings Call Forensics
Valens’ qualitative analysis of the firm’s Q3 2019 earnings call highlights that management is confident they are looking to de-risk their balance sheet.
However, they may be concerned about the feasibility of completing their Atlantic Coast Pipeline, and they may lack confidence in their ability to support clean energy in the Carolinas.
Furthermore, they may be concerned about the impact of Ohio legislation on their profitability, and they may lack confidence in their ability to meet their five-year net income guidance.
UAFRS VS As-Reported

Uniform Accounting metrics also highlight a significantly different fundamental picture for DUK than as-reported metrics reflect.
As-reported metrics can lead investors to view a company to be dramatically stronger or weaker than real operating fundamentals highlight.
Understanding where these distortions occur can help explain why market expectations for the company may be divergent.
As-reported metrics significantly overstate DUK’s margins, a key driver of profitability.
For example, as-reported EBITDA margin for DUK was 44% in 2019, substantially higher than Uniform Earnings Margin of 20%, making DUK appear to be a much stronger business than real economic metrics highlight.
Moreover, since 2003, as-reported metrics have been at least 2x higher than Uniform Earnings Margin, misleading investors to believe DUK has a much higher margin ceiling than is accurate.
SUMMARY and Duke Energy Corporation Tearsheet
As the Uniform Accounting tearsheet for Duke Energy Corporation (DUK:USA) highlights, Duke Energy currently trades at a 34.8x Uniform P/E, which is above both global corporate average valuation levels and its own recent history.
High P/Es require high EPS growth to sustain them. In the case of Duke Energy, the company has recently shown a 8% Uniform EPS growth.
Wall Street analysts provide stock and valuation recommendations that in general provide very poor guidance or insight. However, Wall Street analysts’ near-term earnings forecasts tend to have relevant information.
We take Wall Street forecasts for GAAP earnings and convert them to Uniform earnings forecasts. When we do this, Duke Energy’s Wall Street analyst-driven forecast expects no growth in 2019 and 9% growth in 2020.
Based on current stock market valuations, we can back into the required earnings growth rate that would justify $100 per share. These are often referred to as market embedded expectations. In order to warrant current market valuation levels, Duke Energy would have to have Uniform earnings grow by 12% each year over the next three years.
What Wall Street analysts expect for Duke Energy’s earnings growth falls below what the current stock market valuation requires.
Meanwhile, the company’s earnings power is below corporate averages, signaling that there is a high cash flow risk to the company’s operations and credit profile.
To conclude, the company is trading above corporate and its historical averages and earnings are well below corporate averages. Also, analysts do not expect the firm to achieve its market-required earnings growth.
Best regards,
Joel Litman & Rob Spivey
Chief Investment Strategist &
Director of Research
at Valens Research