
This company enabled the Flash Boys. Valuations require growth. Wall Street analysts and Uniform metrics show a much slower pace ahead.

Tailwinds for this market with continued growth in the high frequency world, and cloud storage and SaaS solutions across all sectors mean that the market thinks this company has significant opportunity for growth.
While as-reported metrics make the company look like it is seeing profitability rise thanks to these trends, TRUE Uniform metrics show the company’s margins haven’t been as robust as they appear.
Also below, Uniform Accounting Embedded Expectations Analysis and the Uniform Accounting Performance and Valuation Tearsheet for the company.
Investor Essentials Daily:
Tuesday Tearsheets
Powered by Valens Research
When Michael Lewis’ Flash Boys came out in 2014, it caused quite a stir. While some on Wall Street had been aware of the phenomenon of high-frequency trading (HFT), the book brought the idea of these traders front-running both institutional and individual investors to the forefront of the public psyche.
The book focused on how milliseconds are the competitive playing field for these traders. Slight improvements in the quality of their connection or how their piping to the exchanges was routed could massivey change their competitive positioning in the market.
Most importantly, the closer the HFTs were to the exchange, the better the advantage they got. They would get the data faster, and react faster, and win. To the point that HFTs were scrambling to rent space in the exchange itself.
With all the focus on whether or not the HFTs were doing the right thing, there was no focus on how they were getting that infrastructure. Much of it they didn’t own—they were leasing not just space, but infrastructure.
The term for this space is a colocation center, and if that colocation center has optimal geographic positioning, the HFT companies were interested.
One of the companies that offer that space is Equinix (EQIX), a REIT focused on data center and colocation center operations.
Equinix of course doesn’t just service HFTs—the company services companies from Lufthansa to BMC Software, and Ellie Mae, a mortgage app provider.
Considering the growing demand for cloud solutions and data storage, even with increased scrutiny for customers like high-frequency traders, it is not surprising that Equinix currently is reaching all-time peak EBITDA Margins. The market also appears to recognize the opportunity for Equinix, pricing the company for significant expansion in their returns going forward.
But as-reported EBITDA Margins are overstating the company’s profitability, making the company appear as if their fundamentals are improving, when they’ve been declining ever since Flash Boys came out in 2014.
Uniform Accounting (UAFRS) margin peaked at 24% in 2014, and has subsequently fallen to levels not seen since 2009. While there are tailwinds for cloud and storage, customers are finding other solutions, hosting on AWS and competitors, as opposed to leasing their own infrastructure, among other initiatives.
Also, Equinix management appears to be growing more pessimistic about their outlook for the company’s ability to drive growth and improve margins. High market expectations, declining returns, and growing management pessimism point to risks for the company.
Equinix Embedded Expectations Analysis – Market expectations are for significant Uniform ROA expansion, but management may be concerned about M&A, growth, and cost headwinds
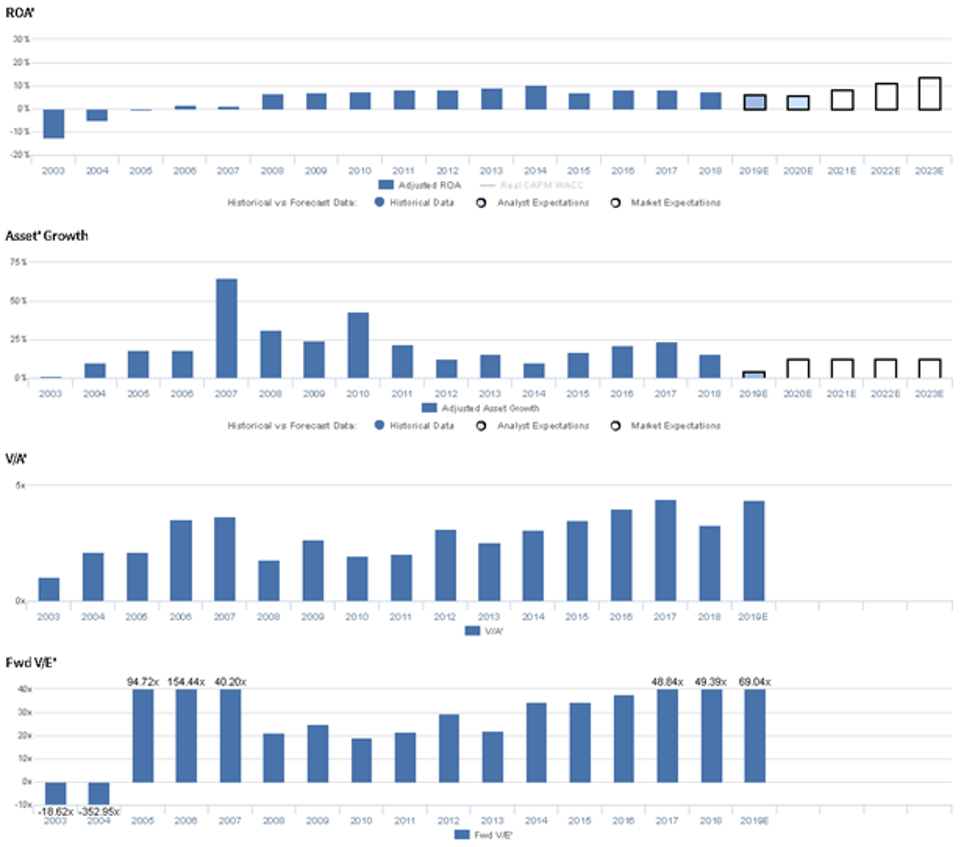
EQIX currently trades above recent averages relative to UAFRS-based (Uniform) Earnings, with a 65.4x Uniform P/E. At these levels, the market is pricing in expectations for Uniform ROA to improve from 8% in 2018 to 16% in 2023, accompanied by 10% Uniform Asset growth going forward.
However, analysts have bearish expectations, projecting Uniform ROA to fall to 7% levels through 2020, accompanied by 5% Uniform Asset growth.
Historically, EQIX has seen improving profitability. Initially, the firm saw relatively weak profitability, with Uniform ROA improving from -12% in 2003 to positive levels in 2006, before improving to 7% in 2008. Then, Uniform ROA improved to a peak of 10% in 2014, before falling to 8% in 2018. Meanwhile, Uniform Asset growth has been robust and positive every year of the past 16 years, ranging from 1% to 65%.
Performance Drivers – Sales, Margins, and Turns
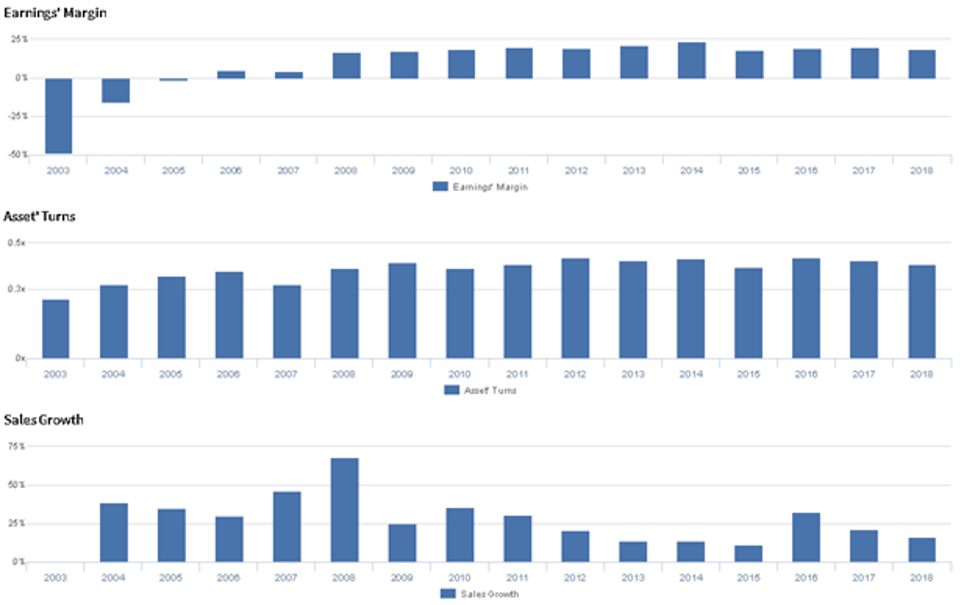
Improvements in Uniform ROA have been driven by trends in both Uniform Earnings Margin and Uniform Asset Turns. Uniform Margins improved from -49% in 2003 to 4%-5% levels from 2006-2007, before improving further to a high of 24% in 2014. Thereafter, Uniform Margins fell to 18%-19% levels from 2015-2018. Meanwhile, from 2003 to 2018, Uniform Turns have sustained 0.3x-0.4x levels, with gradual improvements to the higher side of that range recently.
At current valuations, markets are pricing in expectations for Uniform Margins and Uniform Turns to expand to new highs.
Earnings Call Forensics
Valens’ qualitative analysis of the firm’s Q2 2019 earnings call highlights that management is confident there are headwinds in their network business, and they may lack confidence in their ability to sustain bookings growth in their network vertical. Furthermore, they may lack confidence in their ability to augment their capabilities through M&A and meet their guidance on growth. Finally, they may be concerned about the value of their capital investments, and they may be downplaying the impact of utility spend on EBITDA.
UAFRS VS As-Reported
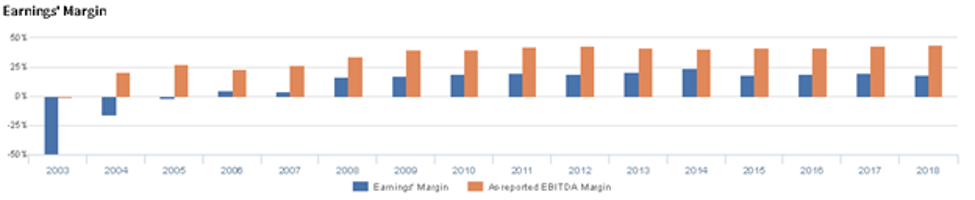
Uniform Accounting metrics also highlight a significantly different fundamental picture for EQIX than as-reported metrics reflect. As-reported metrics can lead investors to view a company to be dramatically stronger or weaker than real operating fundamentals highlight. Understanding where these distortions occur can help explain why market expectations for the company may be divergent.
As-reported metrics significantly overstate EQIX’s margins, one of the primary drivers of profitability. For example, as-reported EBITDA margin for EQIX was near 44% in 2018, materially higher than Uniform Earnings Margin of 19% in the same year, making EQIX appear to be a much stronger business than real economic metrics highlight. Moreover, as-reported margins have been consistently greater than Uniform Margins in each year since 2003, significantly distorting the market’s perception of the firm’s performance for well over a decade.
SUMMARY and Equinix Tearsheet
As the Uniform Accounting tearsheet for Equinix (EQIX) highlights, the Equinix Uniform P/E trades at a very high 65x, well above corporate average valuation levels and its own recent history.
High P/E’s require high EPS growth to sustain them. In the case of EQIX, the company has recently shown only 3% Uniform EPS growth.
Wall Street analysts provide stock and valuation recommendations that in general provide very poor guidance or insight. However, Wall Street analysts’ near-term earnings forecasts tend to have relevant information.
We take Wall Street forecasts for GAAP earnings and convert them to Uniform earnings forecasts. When we do this, EQIX’s Wall Street analyst-driven forecast is a very concerning negative 19% into 2019. That rebounds with only 12% growth in earnings from 2019 to 2020.
Based on current stock market valuations, we can back into the required earnings growth rate that would justify $551 per share. These are often referred to as market embedded expectations. In order to meet the current market valuation levels of EQIX, the company would have to have Uniform earnings grow by 27% each year over the next three years.
What Wall Street analysts expect for EQIX’s earnings growth falls far below what the current stock market valuation requires.
To conclude, EQIX’s Uniform earnings growth is below peer averages in 2020. Yet, the company is trading at well above average peer valuations.
The company’s earning power, based on its Uniform return on assets calculation, is below average as well. Together, this signals a significant cash flow risk to the current dividend level in the future.
Best regards,
Joel Litman & Rob Spivey
Chief Investment Strategist &
Director of Research
at Valens Research