
ESG investing is gaining popularity, and it’s never been a better time to pay attention

With the way the world is heading, the demand and interest in ESG themed funds and companies has skyrocketed.
There’s a notion that it doesn’t pay to be ESG compliant, but that may not be true. Companies that treat their employees, customers, suppliers, and every other member of its stakeholder group equally tend to outperform the market.
Today, we’re taking a look at one of the largest ESG ETFs on the market.
In addition to examining the portfolio, we’re including a deeper look into the fund’s largest current holding, providing you with the current Uniform Accounting Performance and Valuation Tearsheet for that company.
Investor Essentials Daily:
Friday Uniform Portfolio Analytics
Powered by Valens Research
Arguably one of the highest profile themes that has emerged in the investment world over the past five years is the idea of environmental, social, governance (ESG) investing.
This investment philosophy involves choosing companies that do not solely focus on profits, but rather on multi-stakeholder capitalism.
This ensures these companies are incentivized to reward their employees, protect the environment, and innovate to improve the world for future generations.
These firms also tend to make efforts to try and positively contribute to social issues. For example, ESG companies tend to avoid addicting products such as gambling.
Finally, ESG focused companies cultivate a strong alignment between management, employees, and the board of directors with long-term wealth creation and maximization.
Companies that deeply exemplify ESG initiatives tend to generate more sustainable returns. As a result, these companies do not often find their businesses disrupted by operational issues.
There’s an old saying that “endearing companies are enduring ones.”
This is especially true now that investors, particularly the younger generations of investors, are being more mindful of the types of investments they are willing to make. Thus, demand for and attention towards ESG investing has skyrocketed recently.
People are beginning to see the power of companies that treat its employees, customers, suppliers, and every other member of its stakeholder group equally.
Even major equity investors like Norway’s sovereign wealth fund are starting to focus their investment strategies on ESG themes.
Some investors assume ESG companies and themes create no alpha over the market since the market tends to reward bottom line earnings growth.
That’s proved, time and time again, to be false. ESG activities may start as non-financial positive externalities, but they often translate to more sustainable corporate returns too.
One of the most popular ways for investors to try to get exposure to the theme is through ETFs that incorporate companies within real ESG initiatives, including Blackrock’s iShares MSCI USA ESG Select ETF (SUSA).
Considering how popular ESG investing is becoming, we thought it would be beneficial to take a look at the companies in this particular ETF.
By doing so, we can identify whether the companies within the fund are able to earn sustainably stronger returns once we see through the bad accounting noise.
Furthermore, we will identify whether or not the market recognizes the performance and trends of companies within the portfolio.
We’ve conducted a portfolio audit of iShares MSCI’s top equity holdings, based on its most recent 13-F, focusing on their non-financial company holdings.
We’re showing a summarized and abbreviated analysis of how we work with institutional investors to analyze their portfolios.
Unsurprisingly, for the most part, SUSA’s research appears to line up with Uniform Accounting.
Uniform Accounting metrics highlight the company’s equity investments are much higher quality, and have higher potential, than the market and as-reported metrics imply.
See for yourself below.
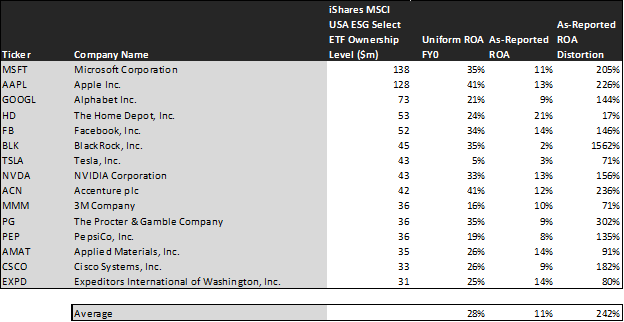
On an as-reported basis, many of these companies are average performers with returns around 11%, roughly in line with the corporate average ROA of around 12%.
However, once we make Uniform Accounting (UAFRS) adjustments to accurately calculate earning power, we can see that the returns of the companies in SUSA’s portfolio are much more robust.
The average company in the portfolio displays an impressive average Uniform return on assets (ROA) at 28%. This is well above corporate average returns.
Once the distortions from as-reported accounting are removed, we can realize Blackrock (BLK) doesn’t have an ROA of 2%, but returns of 35%. Blackrock isn’t a low-return business, it’s a company with robust cash flows.
Similarly, Accenture’s (ACN) ROA is really 41%, not 12%. SUSA’s focus on ESG companies seems to generate robust returns.
Apple (AAPL) is another great example of as-reported metrics mis-representing the company’s profitability.
Apple’s ROA isn’t 13%, it’s actually 41%.
The list goes on from there, for names ranging from Microsoft (MSFT) and NVIDIA (NVDA), to Cisco (CSCO) and Procter & Gamble (PG).
If investors analyzed SUSA’s portfolio using as-reported metrics, it would look significantly weaker.
To find companies that can deliver alpha beyond the market, just finding companies where as-reported metrics mis-represent a company’s real profitability is insufficient.
To generate real alpha, any investor also needs to identify where the market is significantly undervaluing the company’s potential.
SUSA’s ESG portfolio contains a number of companies that the market has low expectations for – low expectations the companies can exceed.

This chart shows three interesting data points:
- The 2-year Uniform EPS growth represents what Uniform earnings growth is forecast to be over the next two years. The EPS number used is the value of when we take consensus Wall Street estimates and we convert them to the Uniform Accounting framework.
- The market expected Uniform EPS growth is what the market thinks Uniform earnings growth is going to be for the next two years. Here, we show by how much the company needs to grow Uniform earnings in the next 2 years to justify the current stock price of the company. If you’ve been reading our daily analyses and reports for a while, you’ll be familiar with the term embedded expectations. This is the market’s embedded expectations for Uniform earnings growth.
- The Uniform EPS growth spread is the spread between how much the company’s Uniform earnings could grow if the Uniform earnings estimates are right, and what the market expects Uniform earnings growth to be.
The average company in the U.S. is forecast to have 5% annual Uniform Accounting earnings growth over the next 2 years. SUSA’s holdings are forecast by analysts to grow by 31%, well above the average.
Despite this, the market is pricing these companies to grow earnings by only 14% a year on average. While these companies are growing faster than the market, they are intrinsically undervalued, as the market is mispricing their growth by 17% on average.
These are the kinds of companies that are likely to see their stocks rally when the market realizes growth potential. This may be the market pricing some of these companies for massive declines in profitability in distressed credit situations. Without Uniform numbers, investors cannot see the strength of these names.
One example of a company in the portfolio that has growth potential the market is mispricing is Tesla (TSLA). Tesla’s analyst forecasts have 306% Uniform earnings growth built in, but the market is pricing the company to have earnings growth by 96% earnings each year for the next two years.
Another company with dislocations is Applied Material (AMAT). While it may not look like its ESG initiatives are helping the firm, Uniform Accounting helps show that sustainable investments help with long-term profitability.
Market expectations call for a 8% growth in earnings. However, the company is actually forecast for Uniform EPS to grow by 27% a year. Applied Materials only has to overcome these sluggish expectations to see upside.
For the most part, SUSA’s holdings are high quality, undervalued portfolios with businesses displaying strong earning power, in many cases thanks to their ESG commitments. This wouldn’t be clear under GAAP, but unsurprisingly Uniform Accounting and a system built to deliver alpha see the same signals.
SUMMARY and Microsoft Corporation Tearsheet
As SUSA’s largest individual stock holding, we’re highlighting Microsoft’s tearsheet today.
As the Uniform Accounting tearsheet for Microsoft Corporation (MSFT:USA) highlights, Microsoft’s Uniform P/E trades at 30.4x, which is above the corporate average valuation of 25.2x and its own historical valuation of 23.7x.
High P/Es require high EPS growth to sustain them. In the case of Microsoft, the company has recently shown a 21% Uniform EPS growth.
Wall Street analysts provide stock and valuation recommendations that in general provide very poor guidance or insight. However, Wall Street analysts’ near-term earnings forecasts tend to have relevant information.
We take Wall Street forecasts for GAAP earnings and convert them to Uniform earnings forecasts. When we do this, Microsoft’s Wall Street analyst-driven forecasts are 26% EPS growth in 2021 and 5% EPS growth in 2022.
Based on current stock market valuations, we can back into the required earnings growth rate that would justify $255.85 per share. These are often referred to as market embedded expectations.
The company can have Uniform earnings grow by 14% each year over the next three years and still justify current price levels. What Wall Street analysts expect for Microsoft’s earnings is above what the current stock market valuation requires in 2021 and below its requirement in 2022.
Furthermore, the company’s earning power is 6x the corporate average. Also, cash flows and cash on hand are significantly exceeding its total obligations—including debt maturities, capex maintenance, and dividends. Together, this signals a low credit and dividend risk.
To conclude, Microsoft’s Uniform earnings growth is below its peer averages, and their valuations are traded below its peers.
Best regards,
Joel Litman & Rob Spivey
Chief Investment Strategist &
Director of Research
at Valens Research


