
This ETF has investors buzzing about it…does it hold up to the hype?

The beginning of this year has seen rampant volatility in the market. Some of the most popular stocks of the past year were the biggest movers, but not always in the right direction.
For those looking to get exposure to the most popular stocks, the VanEck Social Sentiment ETF (BUZZ) tracks the most traded companies in the equity universe at the current moment.
To better understand the benefits of this strategy, let’s use Uniform Accounting to analyze the largest holdings in the ETF and answer a simple question—are the most popular stocks really the best investment?
Also below, a detailed Uniform Accounting tearsheet of the fund’s largest holdings.
Investor Essentials Daily:
Friday Uniform Portfolio Analytics
Powered by Valens Research
Much of the market is dictated by a select group of equities. These companies hold large market capitalizations and are often heavily traded.
The markets have seen significant volatility in both directions in recent weeks, in part driven by these big players.
In fact, just earlier this month, we saw this happen entering the heart of earnings season.
Some of the largest names of the past couple of years consistently experienced dramatic swings in after-hours trading.
The swings were scattered in both directions, from Facebook (FB) dropping 22%, and Snapchat (SNAP) dropping 40%, before rising 60%. Snapchat experienced its crash and subsequent recovery all in between it being “open” for trading.
Volatility didn’t stop there, as Amazon (AMZN) rose 17% and pandemic darling Peloton (PTON) soared higher with rumors of a potential acquisition.
These dramatic shifts were only a handful of the large moves that occurred in big stocks in the past month.
To many investors, the volatility of typically more stable stocks is a sign of a chaotic market that is being distorted by computer trading models.
While there may be some merit to the impact these algorithmic models are having on the markets, as well as the fact that some of these companies are fad companies, there is a more apparent factor at play.
The biggest swing factor in these dramatic changes is that these are companies that are closely tracked by active traders, and their increased activity is swinging their prices more frequently than people are used to.
We first saw the first hand impact retail investors could have last year as popular stocks such as GameStop (GME) and BlackBerry (BB) rapidly surged in value.
Roughly a year ago we highlighted an ETF designed to specifically track which companies traders were currently paying the most attention to.
VanEck Vectors Social Sentiment ETF (BUZZ), has the goal of focusing on these companies and also happens to have tracked many of the big swinging names we have noticed over the past year.
As we are now a year out from our initial review, now is a good opportunity to understand if exceptionally high expectations are a significant factor in the dramatic swings we have seen. With another year of volatility in the market, let’s reexamine this ETF through our Uniform Accounting lens.
The VanEck Social Sentiment ETF operates in a manner dissimilar to many of its contemporaries.
Rather than track a particular benchmark, or a particular segment, the ETF tracks the most popular companies on the market.
With their investments ranging from large technology companies like Apple (AAPL) and Amazon.com (AMZN) to stock made popular by retail investors such as GameStop (GME) and AMC Entertainment (AMC), we can see they have a broad investment horizon.
With such a diverse set of investments, it can become difficult to understand which companies are actually poised to succeed compared to their market pricing.
Economic productivity is massively misunderstood on Wall Street. This is reflected by the 130+ distortions in the Generally Accepted Accounting Principles (GAAP) that make as-reported results poor representations of real economic productivity.
These distortions include the poor capitalization of R&D, the use of goodwill and intangibles to inflate a company’s asset base, a poor understanding of one-off expense line items, and flawed acquisition accounting.
It is no surprise that once many of these distortions are accounted for, it becomes apparent which companies are in reality robustly profitable and which may not be as strong of an investment.
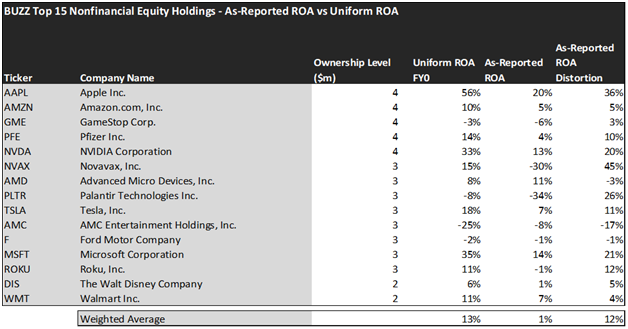
The average as-reported ROA among BUZZ’s top 15 names is a minuscule 1%, which doesn’t even beat the average cost of capital in the market. In reality, these companies perform far better, with a 13% Uniform ROA.
Apple (AAPL), for example, doesn’t return 20%. It actually boasts a 56% Uniform ROA, which is representative of its strong position in the industry.
Similarly, Novavax (NVAX) does not have -30% returns. As a biotechnology firm with a strong product line, it has a 15% Uniform ROA.
These dislocations demonstrate that most of these firms are in a stronger financial position than GAAP may make their books appear. But there is another crucial step in the search for alpha. Investors need to also find companies that are performing better than their valuations imply.
Valens has built a systematic process called Embedded Expectations Analysis to help investors get a sense of the future performance already baked into a company’s current stock price. Take a look:

This chart shows four interesting data points:
- The Uniform ROA FY0 represents the company’s current return on assets, which is a crucial benchmark for contextualizing expectations.
- The analyst-expected Uniform ROA represents what ROA is forecast to be over the next two years. To get the ROA number, we take consensus Wall Street estimates and we convert them to the Uniform Accounting framework.
- The market-implied Uniform ROA is what the market thinks Uniform ROA is going to be in the three years following the analyst expectations, which for most companies here is 2023, 2024, and 2025. Here, we show the sort of economic productivity a company needs to achieve to justify its current stock price.
- The Uniform P/E is our measure of how expensive a company is relative to its Uniform earnings. For reference, average Uniform P/E across the investing universe is roughly 24x.
Embedded Expectations Analysis of BUZZ paints a clear picture of the ETF. The stocks it tracks are pretty expensive.
While analysts expect the average ROA to increase from 13% to 30%, the market is pricing these companies to grow their economic profitability to 33%.
A company like AMC Entertainment that has already struggled in recent quarters to perform up to market pricing, may struggle to reach 7% ROA compared to analyst expectations of just 3%.
Bullish expectations on companies like AMC create situations where investors may find themselves disappointed.
This just goes to show the importance of valuation in the investing process. Finding the most popular firms is only half of the process. The other, just as important part, is attaching reasonable valuations to the companies and understanding which are the most fundamentally sound investments.
To see a list of companies that have great performance and innovation also at attractive valuations, the Valens Conviction Long List is the place to look. The conviction list is powered by the Valens database, which offers access to full Uniform Accounting metrics for thousands of companies.
Click here to get access.
Read on to see a detailed tearsheet of the largest holding in BUZZ.
SUMMARY and Apple Inc. Tearsheet
As VanEck Social Sentiment ETF’s largest individual stock holdings, we’re highlighting Apple Inc. (AAPL) tearsheet today.
As the Uniform Accounting tearsheet for Apple highlights, its Uniform P/E trades at 25.6x, which is around the global corporate average of 24.0x, but above its historical average of 20.8x.
Moderate P/Es require moderate EPS growth to sustain them. In the case of Apple, the company has recently shown a 71% Uniform EPS growth.
Wall Street analysts provide stock and valuation recommendations that, in general, provide very poor guidance or insight. However, Wall Street analysts’ near-term earnings forecasts tend to have relevant information.
We take Wall Street forecasts for GAAP earnings and convert them to Uniform earnings forecasts. When we do this, Apple’s Wall Street analyst-driven forecast is for EPS to grow by 7% in 2022, and immaterially in 2023.
Based on the current stock market valuations, we can use earnings growth valuation metrics to back into the required growth rate to justify Apple’s $173 stock price. These are often referred to as market embedded expectations.
The company is currently being valued as if Uniform earnings were to grow 7% annually over the next three years. What Wall Street analysts expect for Apple’s earnings growth meets what the current stock market valuation requires in 2022, but falls short in 2023.
Meanwhile, the company’s earning power is 9x the long-run corporate averages. Additionally, cash flows and cash on hand are 3x total obligations—including debt maturities and capex maintenance. Furthermore, Apple’s iCDS is 20bps above the risk-free rate. Together, these signal low dividend and credit risks.
Lastly, Apple’s Uniform earnings growth is below its peer averages. However, the company is trading above its average peer valuations.
Best regards,
Joel Litman & Rob Spivey
Chief Investment Strategist &
Director of Research
at Valens Research