
This ETF stands out for investors betting on the US infrastructure

As we’ve mentioned before, the US has been underinvesting in its infrastructure for many years.
With the emergence of the pandemic and related supply chain disruptions, this situation became more apparent than ever.
Now, we need to invest heavily in developing our supply chains and infrastructure. The beneficiaries of this will be the key service suppliers and manufacturers.
For investors that want to benefit from this trend, iShares U.S. Infrastructure ETF (BATS:IFRA) might be a good option.
Let’s see the top holdings in this ETF and evaluate it from the Uniform Accounting perspective.
In addition to examining the portfolio, we include a deeper look into the fund’s largest current holding, providing you with the current Uniform Accounting Performance and Valuation Tearsheet for that company.
Also below is a detailed Uniform Accounting tearsheet of the fund’s largest holding.
Investor Essentials Daily:
Friday Uniform Portfolio Analytics
Powered by Valens Research
For quite some time, we have been calling for a supply-chain supercycle.
Even though the broader economy is teetering, and we may enter a recession in the near future, we still think infrastructure is going to be the backbone of the next bull market.
We have several trends converging in our favor.
The first is the massive investments into US infrastructure. The supply chain issues in the pandemic made us all realize how crucial it is to have a modernized infrastructure and more robust logistic networks.
Secondly, with the ongoing international supply-chain risks, especially created by China and Russia, we’ve started to see a huge trend toward nearshoring and onshoring.
These problems highlight how dependent we are on long and complex international supply chains, and when a problem occurs, its impact can be far more amplified than one might initially expect.
Government is trying to do something about this. The multi-billion dollar infrastructure bill that was signed by President Biden is meant to provide a significant fund that will help companies to improve our supply-chain resiliency and develop and modernize our infrastructure.
For all these reasons, we like the sectors and companies that provide key services and products to the development of our infrastructure.
One useful way to get exposure to this trend is the iShares U.S. Infrastructure ETF (IFRA).
Today we will take a look at the top holdings in this ETF and evaluate the portfolio using the Uniform Accounting framework.
We can understand if these names are priced for an investment supercycle, or if the market hasn’t caught on yet.
Valens has built a systematic process called Embedded Expectations Analysis to help investors get a sense of the future performance already baked into a company’s current stock price. Take a look
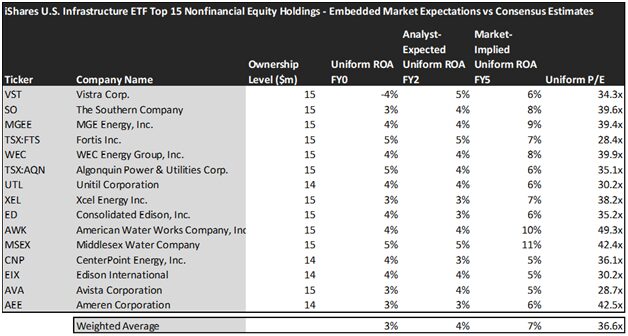
This chart shows four interesting data points:
- The average Uniform ROA among iShares U.S. Infrastructure ETF’s top 15 holdings is actually 3%, which is below the corporate average.
- The analyst-expected Uniform ROA represents what ROA is forecasted to do over the next two years. To get the ROA value, we take consensus Wall Street estimates and convert them to the Uniform Accounting framework.
- The market-implied Uniform ROA is what the market thinks Uniform ROA is going to be in the three years following the analyst expectations, which for most companies here are 2023, 2024, and 2025. Here, we show the sort of economic productivity a company needs to achieve to justify its current stock price.
- The Uniform P/E is our measure of how expensive a company is relative to its Uniform earnings. For reference, the average Uniform P/E across the investing universe is roughly 20x.
Embedded Expectations Analysis of iShares U.S. Infrastructure ETF paints a clear picture. Over the next few years, Wall Street analysts expect the companies in the fund to slightly increase their profitability. The market is a little bit more optimistic.
Analysts forecast the portfolio holdings on average to see Uniform ROA improve to 4% over the next two years. At current valuations, the market’s expectations are higher than analysts and it expects a 7% Uniform ROA for the companies in the portfolio.
The market appears to have sniffed out the supply chain supercycle, at least for this set of companies.
For instance, Southern Co (SO) returned 3% this year. Analysts think its returns will increase slightly to 4%. And at a 39.6x Uniform P/E, the market expects profitability to rise further and is pricing Uniform ROA to be around 8%.
Similarly, Avista Corporation’s (AVA) Uniform ROA is 3%. Analysts expect its returns will improve to 4%, but the market has slightly more optimistic views on the company and pricing its returns to be around 5%.
The high expectations of the market for these names could be concerning as it limits the upside potential.
Investors should be very careful in analyzing current valuations and the market’s expectations before making any investment decisions. And they may want to look elsewhere for ways to play the infrastructure boom.
This just goes to show the importance of valuation in the investing process. Finding a company with strong profitability and growth is only half of the process. The other, just as important part, is attaching reasonable valuations to the companies and understanding which have upside which has not been fully priced into their current prices.
To see a list of companies that have great performance and stability also at attractive valuations, the Valens Conviction Long Idea List is the place to look. The conviction list is powered by the Valens database, which offers access to full Uniform Accounting metrics for thousands of companies.
Click here to get access.
Read on to see a detailed tearsheet of one of iShares U.S. Infrastructure ETF’s largest holdings.
SUMMARY and Vistra Corp. Tearsheet
As one of iShares U.S. Infrastructure ETF’s largest individual stock holdings, we’re highlighting Vistra Corp. (VST:USA) tearsheet today.
As the Uniform Accounting tearsheet for Vistra Corp. highlights, its Uniform P/E trades at 34.3x, which is above the global corporate average of 18.4x, and its historical average of -0.0x.
High P/Es require high EPS growth to sustain them. In the case of Vistra Corp., the company has recently shown 2% Uniform EPS shrinkage.
Wall Street analysts provide stock and valuation recommendations that, in general, provide very poor guidance or insight. However, Wall Street analysts’ near-term earnings forecasts tend to have relevant information.
We take Wall Street forecasts for GAAP earnings and convert them to Uniform earnings forecasts. When we do this, Vistra Corp.’s Wall Street analyst-driven forecast is for EPS to shrink by 148% in 2023 and shrink by 6% in 2024.
Furthermore, the company’s return on assets was -4% in 2022, which is below the long-run corporate averages. Also, cash flows and cash on hand fall short of its total obligations—including debt maturities and CAPEX maintenance. Moreover, its intrinsic credit risk is 220bps above the risk-free rate. Together, these signal high dividend risks and moderate credit risks.
Lastly, Vistra Corp.’s Uniform earnings growth is below peer averages, and in line with peer valuations.
Best regards,
Joel Litman & Rob Spivey
Chief Investment Strategist &
Director of Research
at Valens Research


