
The ETFs based on infamous TV host’s stock picks are now tradable

In November, we talked about the emergence of a new set of exchange-traded funds (ETFs) that are based on the stock picks of one of the most famous TV hosts, Jim Cramer.
Cramer has made a name for himself by presenting controversial investment ideas that have repeatedly been proven wrong by the market.
Now, his followers have the chance to trust his ideas and buy the Long Cramer Tracker ETF (LJIM) or to go against him by taking a position in the Short Cramer Tracker ETF (SJIM).
Let’s see his favorite stock picks using Uniform Accounting and evaluate if Cramer’s portfolio can outperform the market this time.
In addition to examining the portfolio, we include a deeper look into the fund’s largest current holding, providing you with the current Uniform Accounting Performance and Valuation Tearsheet for that company.
Also below is a detailed Uniform Accounting tearsheet of the fund’s largest holding.
Investor Essentials Daily:
Friday Uniform Portfolio Analytics
Powered by Valens Research
Cramer might not be the smartest guy in the room, and he might be wrong almost all the time but it does not change the fact that he has tons of people listening to him.
His TV show, “Mad Money” has been one of the most popular in financial media since its launch in 2005.
The attention he receives for his stock picks and people’s comments on his ideas have created a demand for a financial instrument that can track his performance.
Recognizing this opportunity, Tuttle Capital Management filed prospectuses last fall for two ETFs that track Cramer’s recommendations.
Finally, the long-awaited ETFs launched around 3 weeks ago.
People who agree and trust Cramer’s stock picks can now buy the LJIM ETF, while those who want to take the opposite position can buy the SJIM ETF.
Based on his past performances, it looks like the SJIM ETF would be getting much more demand.
His famous bad picks include recommending to buy Bear Stearns in 2008, and the bank collapsed 5 days after his recommendation.
Since the launch, those who have taken the opposite position of Cramer have been winning, earning a return of around 3% in three weeks.
Conversely, those who trusted him lost around 5% during that same timeframe.
Let’s see the fund’s top holdings and evaluate if it can prove to his believers that he’s on the right track.
Economic productivity is massively misunderstood on Wall Street. This is reflected by the 130+ distortions in the Generally Accepted Accounting Principles (GAAP) that make as-reported results poor representations of real economic productivity.
These distortions include the poor capitalization of R&D, the use of goodwill and intangibles to inflate a company’s asset base, a poor understanding of one-off expense line items, as well as flawed acquisition accounting.
It’s no surprise that once many of these distortions are accounted for, it becomes apparent which companies are in real robust profitability and which may not be as strong of an investment.
See for yourself below.
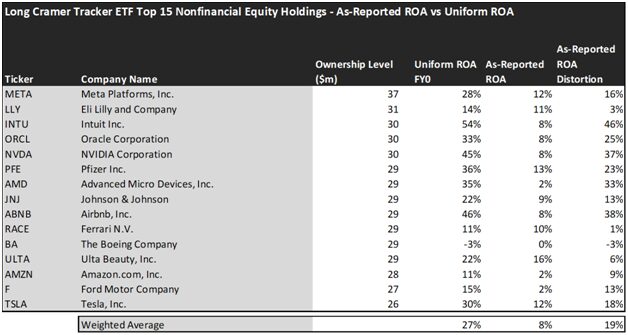
Looking at as-reported accounting numbers, investors would think that investing with Jim Cramer was a mistake.
On an as-reported basis, many of the companies in the fund are poor performers. The average as-reported ROA for the top 15 holdings of the fund is 8%, which is below the U.S. corporate average.
However, once we make Uniform Accounting adjustments to accurately calculate the earning power, we can see that the average return in Long Cramer Tracker ETF’s top 15 holdings is actually 27%.
As the distortions from as-reported accounting are removed, we can see that Airbnb (ABNB) isn’t an 8% return business. Its Uniform ROA is 46%.
Meanwhile, NVIDIA Corporation (NVDA) looks like an 8% return business, but this massive semiconductor company actually powers a 45% Uniform ROA.
To find companies that can deliver alpha beyond the market, just finding companies where as-reported metrics misrepresent a company’s real profitability is insufficient.
To really generate alpha, any investor also needs to identify where the market is significantly undervaluing the company’s potential.
These dislocations demonstrate that most of these firms are in a different financial position than GAAP may make their books appear. But there is another crucial step in the search for alpha. Investors need to also find companies that are performing better than their valuations imply.
Valens has built a systematic process called Embedded Expectations Analysis to help investors get a sense of the future performance already baked into a company’s current stock price. Take a look:
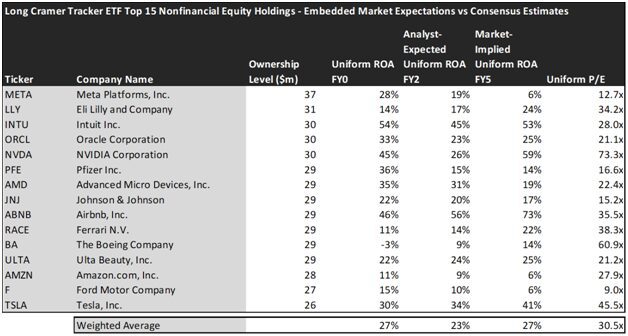
This chart shows four interesting data points:
- The average Uniform ROA among Long Cramer Tracker ETF’s top 15 holdings is actually 27% which is much better than the corporate average in the United States.
- The analyst-expected Uniform ROA represents what ROA is forecasted to do over the next two years. To get the ROA value, we take consensus Wall Street estimates and convert them to the Uniform Accounting framework.
- The market-implied Uniform ROA is what the market thinks Uniform ROA is going to be in the three years following the analyst expectations, which for most companies here are 2023, 2024, and 2025. Here, we show the sort of economic productivity a company needs to achieve to justify its current stock price.
- The Uniform P/E is our measure of how expensive a company is relative to its Uniform earnings. For reference, the average Uniform P/E across the investing universe is roughly 20x.
Embedded Expectations Analysis of Long Cramer Tracker ETF paints a clear picture. Over the next few years, Wall Street analysts expect the companies in the fund to slightly decline in profitability, while the market thinks they will remain flat.
Analysts forecast the portfolio holdings on average to see Uniform ROA decline to 23% over the next two years. At current valuations, the market’s expectations are higher than analysts and it expects a 27% Uniform ROA for the companies in the portfolio.
For instance, Intuit (INTU) returned 54% this year. Analysts think its returns will fall slightly to 45%. And at a 28.0x Uniform P/E, the market expects profitability to remain flat and is pricing Uniform ROA to be around 53%.
Similarly, Oracle Corporation’s (ORCL) Uniform ROA is 33%. Analysts expect its returns will drop to 23%, but the market is slightly more optimistic and pricing its returns to be around 25%.
Overall, the Long Cramer Tracker ETF has well-known names in its portfolio but the market’s high expectations for these companies limit the upside potential for its investors. It looks like Cramer might upset his believers once again. This is important to note for investors as they should not blindly follow any investment advice before carefully analyzing the market’s expectations and current valuations.
This just goes to show the importance of valuation in the investing process. Finding a company with strong profitability and growth is only half of the process. The other, just as important part, is attaching reasonable valuations to the companies and understanding which have upside which has not been fully priced into their current prices.
To see a list of companies that have great performance and stability also at attractive valuations, the Valens Conviction Long Idea List is the place to look. The conviction list is powered by the Valens database, which offers access to full Uniform Accounting metrics for thousands of companies.
Click here to get access.
Read on to see a detailed tearsheet of one of Long Cramer Tracker ETF’s largest holdings.
SUMMARY and Eli Lilly and Company Tearsheet
As one of Long Cramer Tracker ETF’s largest individual stock holdings, we’re highlighting Eli Lilly and Company (LLY:USA) tearsheet today.
As the Uniform Accounting tearsheet for Eli Lilly and Company highlights, its Uniform P/E trades at 34.2x, which is above the global corporate average of 18.4x, and its historical average of 31.2x.
High P/Es require high EPS growth to sustain them. In the case of Eli Lilly and Company, the company has recently shown 2% Uniform EPS growth.
Wall Street analysts provide stock and valuation recommendations that, in general, provide very poor guidance or insight. However, Wall Street analysts’ near-term earnings forecasts tend to have relevant information.
We take Wall Street forecasts for GAAP earnings and convert them to Uniform earnings forecasts. When we do this, Eli Lilly and Company’s Wall Street analyst-driven forecast is for EPS to shrink by 3% in 2023 and grow by 40% in 2024.
Furthermore, the company’s return on assets was 14% in 2022, which is 2x the long-run corporate averages. Also, cash flows and cash on hand consistently exceed its total obligations—including debt maturities and CAPEX maintenance. Moreover, its intrinsic credit risk is 30bps above the risk-free rate. Together, these signal low dividend risks and low credit risks.
Lastly, Eli Lilly and Company’s Uniform earnings growth is above peer averages, and above peer valuations.
Best regards,
Joel Litman & Rob Spivey
Chief Investment Strategist &
Director of Research
at Valens Research


