
This famous hedge fund beat all its rivals in year-to-date performance

2022 has been a nightmare for many hedge funds. Despite the name, not every fund is prepared for this much volatility, leaving many underperforming even in this terrible market.
But there is one fund in particular that hasn’t just outperformed the stock market – it’s massively positive this year.
Citadel has generated double-digit returns in all four of its hedge funds year-to-date. Let’s look at the top 15 holdings of its Citadel Wellington fund using Uniform Accounting and evaluate what made the strategy so successful.
In addition to examining the portfolio, we’re including a deeper look into the fund’s largest current holding, providing you with the current Uniform Accounting Performance and Valuation Tearsheet for that company.
Also below, a detailed Uniform Accounting tearsheet of the fund’s largest holding.
Investor Essentials Daily:
Friday Uniform Portfolio Analytics
Powered by Valens Research
It’s been a brutal year for investors. This is one of the worst years on record when you start looking across multiple asset classes. The stock market is down 20%, housing prices are down double-digits, and even bonds are down 15%.
Traditional inflation hedges aren’t doing much better. Gold is down 10% year-to-date, and Bitcoin proved it’s by no means a hedge – it’s down 58% year-to-date.
When talking about hedges, one type has mixed results – hedge funds.
Many hedge funds are set up to take advantage of volatility. That’s the goal, at least. Hedge fund markets haven’t been immune to selloffs.
68% of global hedge funds have had net outflows this year – meaning investors are redeeming their positions. Through September, $146 billion left through outflows.
Depending where you look within hedge funds, some have held up alright. Quant funds that rely on algorithms and often high-frequency trading are actually up about 11% this year. Stock picking hedge funds, namely long-biased and long-short funds, are down about 14%.
One of the biggest names in the business, Ken Griffin, is sitting at the top. Ken Griffin launched Citadel in 1990, and his various funds have more than $50 billion in AUM.
Even though Citadel has funds across multiple strategies, every single one of them is doing well this year. Citadel’s fixed income fund is up 24% year-to-date, its tactical trading fund is up 21%, its equity fund is up 17%, and the best of them all, its flagship Wellington fund is up 29%.
The Wellington fund is a multi-strategy fund, meaning it relies on bits and pieces of investments from the other funds. It combines long-term equity investing, quantitative trading, and fixed income.
While Citadel was delivering these incredible returns, its competitors haven’t lived up to expectations.
Clearly, we can learn a thing or two about portfolio management from studying Citdel’s equity investments.
In this context, let’s see what Citadel’s top holdings are in to understand how they’re doing so well through the Uniform Accounting perspective.
Economic productivity is massively misunderstood on Wall Street. This is reflected by the 130+ distortions in the Generally Accepted Accounting Principles (GAAP) that make as-reported results poor representations of real economic productivity.
These distortions include the poor capitalization of R&D, the use of goodwill and intangibles to inflate a company’s asset base, a poor understanding of one-off expense line items, as well as flawed acquisition accounting.
It’s no surprise that once many of these distortions are accounted for, it becomes apparent which companies are in real robust profitability and which may not be as strong of an investment.
See for yourself below.
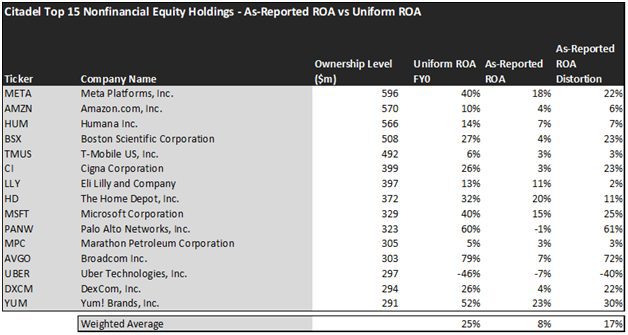
Using as-reported accounting, investors would think that Citadel is even below average and their returns are not really rewarding.
On an as-reported basis, many of the companies in the fund are bad performers. The average as-reported ROA for the top 15 holdings of the fund is 8%, which is less than the U.S. corporate average.
However, once we make Uniform Accounting adjustments to accurately calculate earning power, we can see that the average return in Citadel’s top 15 holdings is 25%.
As the distortions from as-reported accounting are removed, Meta (META) isn’t an 18% return business. Its Uniform ROA is 40%.
Meanwhile, Broadcom (AVGO) looks like a 7% return business. This massive semiconductor company is one of the largest holders of patents in the semiconductor industry and its innovation-driven business model actually powers a 79% Uniform ROA.
To find companies that can deliver alpha beyond the market, just finding companies where as-reported metrics misrepresent a company’s real profitability is insufficient.
To really generate alpha, any investor also needs to identify where the market is significantly undervaluing the company’s potential.
These dislocations demonstrate that most of these firms are in a different financial position than GAAP may make their books appear. But there is another crucial step in the search for alpha. Investors need to also find companies that are performing better than their valuations imply.
Valens has built a systematic process called Embedded Expectations Analysis to help investors get a sense of the future performance already baked into a company’s current stock price. Take a look:
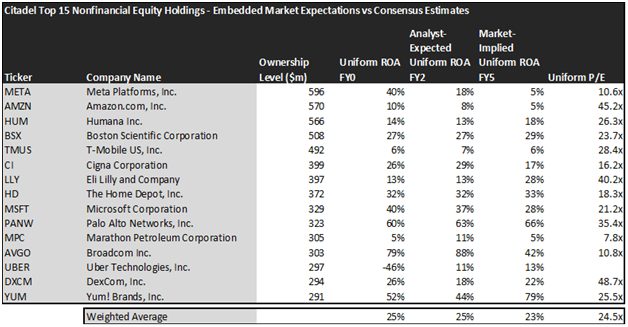
This chart shows four interesting data points:
- The average Uniform ROA among Citadel’s top 15 holdings is actually 25% which is more than two times the corporate average.
- The analyst-expected Uniform ROA represents what ROA is forecasted to do over the next two years. To get the ROA value, we take consensus Wall Street estimates and convert them to the Uniform Accounting framework.
- The market-implied Uniform ROA is what the market thinks Uniform ROA is going to be in the three years following the analyst expectations, which for most companies here are 2023, 2024, and 2025. Here, we show the sort of economic productivity a company needs to achieve to justify its current stock price.
- The Uniform P/E is our measure of how expensive a company is relative to its Uniform earnings. For reference, the average Uniform P/E across the investing universe is roughly 20x.
Embedded Expectations Analysis of Citadel paints a clear picture. Over the next few years, Wall Street analysts expect the companies in the fund to stay flat in profitability and the market’s expectations are in line with the analysts.
Analysts forecast the portfolio holdings on average to see Uniform ROA remain at 25% over the next two years. At current valuations, the market agrees with the analysts by expecting a 23% Uniform ROA for the companies in Citadel’s portfolio.
For instance, cybersecurity firm Palo Alto Networks (PANW) returned 60% this year. Analysts think its returns will improve slightly to 63%. And at a 35.4x Uniform P/E, the market is already pricing Uniform ROA to keep rising to 66%.
Similarly, Home Depot’s (HD) Uniform ROA is 32%. Both analysts and the market are pricing its returns to stay more or less flat.
Overall, Citadel has picked high-quality companies in its successful portfolio, but it seems like the market understands how good they are. However, investors shouldn’t run to buy Citadel’s funds immediately, as the current prices need a detailed valuation analysis before making a decision.
This just goes to show the importance of valuation in the investing process. Finding a company with strong profitability and growth is only half of the process. The other, just as important part, is attaching reasonable valuations to the companies and understanding which have upside which has not been fully priced into their current prices.
To see a list of companies that have great performance and stability also at attractive valuations, the Valens Conviction Long Idea List is the place to look. The conviction list is powered by the Valens database, which offers access to full Uniform Accounting metrics for thousands of companies.
Click here to get access.
Read on to see a detailed tearsheet of one of Citadel’s largest holdings.
SUMMARY and Meta Platforms Inc. Tearsheet
As one of Citadel’s largest individual stock holdings, we’re highlighting Meta Platforms Inc.’s (META:USA) tearsheet today.
As the Uniform Accounting tearsheet for Meta Platforms Inc. highlights, its Uniform P/E trades at 10.6x, which is below the global corporate average of 17.8x, and its historical average of 16.7x.
Low P/Es require low EPS growth to sustain them. That said, in the case of Meta Platforms Inc., the company has recently shown 42% Uniform EPS growth.
Wall Street analysts provide stock and valuation recommendations that, in general, provide very poor guidance or insight. However, Wall Street analysts’ near-term earnings forecasts tend to have relevant information.
We take Wall Street forecasts for GAAP earnings and convert them to Uniform earnings forecasts. When we do this, Meta Platforms Inc.’s Wall Street analyst-driven forecast is for EPS to shrink by 27% and 2% in 2022 and 2023, respectively.
Furthermore, the company’s return on assets was 40% in 2022, which is 7x the long-run corporate averages. Also, cash flows and cash on hand consistently exceed its total obligations—including debt maturities and CAPEX maintenance. Moreover, its has low operating risk.
Lastly, Meta Platforms Inc.’s Uniform earnings growth is above peer averages, and below peer valuations.
Best regards,
Joel Litman & Rob Spivey
Chief Investment Strategist &
Director of Research
at Valens Research


