
This fledgling ETF shows the risk of investing too early

In the fast-paced world of finance, innovative investment strategies are often heralded as potential game-changers.
One such venture that captured the imagination of aspiring young market enthusiasts was The Generation Z ETF.
The fund was launched in 2021 by a group of ambitious teenagers aiming to capitalize on the interests of their own generation.
However, by March 2023, the once-promising fund had fallen short of its goals, struggling to attract a substantial investor base and closing up shop.
Today, we are going to review the ETF’s top 15 holdings using Uniform Accounting to give us an idea of why it may have failed.
In addition to examining the portfolio, we include a deeper look into the fund’s largest current holding, providing you with the current Uniform Accounting Performance and Valuation Tearsheet for that company.
Also below is a detailed Uniform Accounting tearsheet of the fund’s largest holding.
Investor Essentials Daily:
Friday Uniform Portfolio Analytics
Powered by Valens Research
Baby Boomers have long been the driving force behind the American economy. But as they transition into retirement, their wealth growth has slowed.
This generational shift opened up opportunities for other demographics to seize the economic spotlight.
Gen X, the generation sandwiched between Boomers and Millennials, is also inching closer to a stage where wealth utilization takes precedence over accumulation.
But it is Generation Z, the youngest cohort to enter the workforce, that holds the greatest promise for fueling future economic growth.
While it is still the smallest economic generator today, Gen Z is poised to rapidly expand its financial influence. With the oldest members of this generation just a few years out of college, it won’t be long before they begin to accelerate their generational wealth.
As Generation Z starts amassing its financial power, companies catering to its unique needs and preferences are positioned for substantial growth.
Following this trend, a group of high-school teenagers wanted to capitalize on this idea and created The Generation Z ETF in December 2021.
The fund’s investment approach was based on establishing a Gen-Z score by evaluating the level of engagement between Gen-Z individuals (born after January 1, 1997) and a company, as well as the company’s deliberate efforts in targeting this demographic.
In addition, the evaluation considered the extent to which a firm’s mission aligns with the fundamental values held by Gen Z.
However, this innovative and thematic approach could not catch the attention of investors and recorded significant losses last year.
By March 2023, the fund liquidated all assets and went out of business. Let’s have a look at the top holdings of the ETF and see the reasons for this underperformance and lack of investor attention.
Economic productivity is massively misunderstood on Wall Street. This is reflected by the 130+ distortions in the Generally Accepted Accounting Principles (GAAP) that make as-reported results poor representations of real economic productivity.
These distortions include the poor capitalization of R&D, the use of goodwill and intangibles to inflate a company’s asset base, a poor understanding of one-off expense line items, as well as flawed acquisition accounting.
It’s no surprise that once many of these distortions are accounted for, it becomes apparent which companies are in real robust profitability and which may not be as strong of an investment.
See for yourself below.
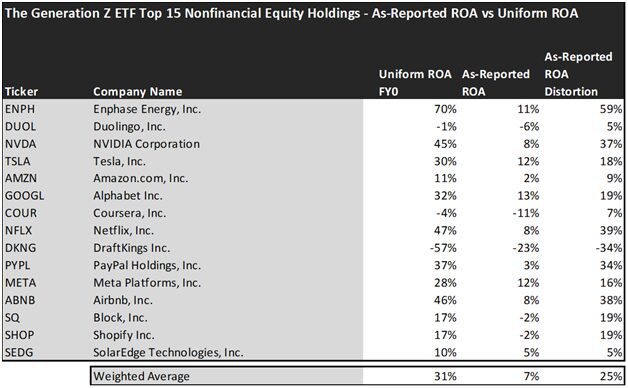
Looking at The Generation Z ETF’s top holdings we can see that most of the names are technology companies, reflecting Gen Z’s interest in high-tech solutions.
On an as-reported basis, many of the companies in the fund are poor performers. The average as-reported ROA for the top 15 holdings of the fund is 7%, which is below the U.S. corporate average.
However, once we make Uniform Accounting adjustments to accurately calculate the earning power, we can see that the average return in The Generation Z ETF’s top 15 holdings is actually 31%.
As the distortions from as-reported accounting are removed, we can see that Enphase Energy (ENPH) isn’t an 11% return business. Its Uniform ROA is 70%.
Meanwhile, Airbnb (ABNB) looks like a poor performer with only an 8% return, but this innovative homestay platform has been one of the favorites of Gen Z and it actually powers a 46% Uniform ROA.
That being said, to find companies that can deliver alpha beyond the market, just finding companies where as-reported metrics misrepresent a company’s real profitability is insufficient.
To really generate alpha, any investor also needs to identify where the market is significantly undervaluing the company’s potential.
These dislocations demonstrate that most of these firms are in a different financial position than GAAP may make their books appear. But there is another crucial step in the search for alpha. Investors need also to find companies that are performing better than their valuations imply.
Valens has built a systematic process called Embedded Expectations Analysis to help investors get a sense of the future performance already baked into a company’s current stock price. Take a look:
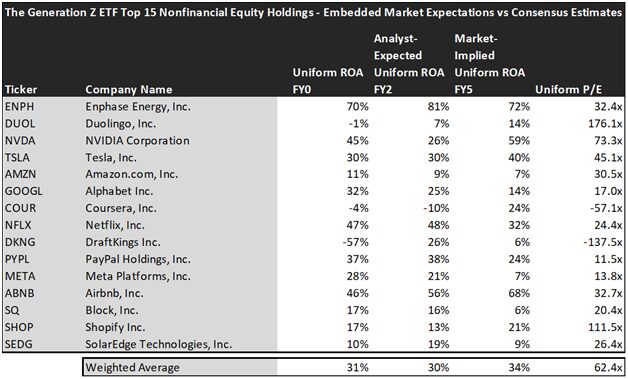
This chart shows four interesting data points:
- The average Uniform ROA among The Generation Z ETF’s top 15 holdings is actually 31%, which is much better than the corporate average in the United States.
- The analyst-expected Uniform ROA represents what ROA is forecasted to do over the next two years. To get the ROA value, we take consensus Wall Street estimates and convert them to the Uniform Accounting framework.
- The market-implied Uniform ROA is what the market thinks Uniform ROA is going to be in the three years following the analyst expectations, which for most companies here are 2023, 2024, and 2025. Here, we show the sort of economic productivity a company needs to achieve to justify its current stock price.
- The Uniform P/E is our measure of how expensive a company is relative to its Uniform earnings. For reference, the average Uniform P/E across the investing universe is roughly 20x.
Embedded Expectations Analysis of The Generation Z ETF paints a clear picture. Over the next few years, Wall Street analysts expect the companies in the fund to remain near current profitability levels, with just a slight decline.
On the other hand, the market thinks these companies will perform better in the next few years and is pricing in a slight improvement in profitability. The average Uniform P/E ratio of the top 15 holdings is 62 times. That’s well above the market average and the market expects the companies to reach better profitability levels.
Analysts forecast the portfolio holdings on average to see Uniform ROA maintain current levels around 30% over the next two years. At current valuations, the market’s expectations are higher analysts and it expects a 34% Uniform ROA for the companies in the portfolio as well.
For instance, Tesla (TSLA) returned 30% this year. Analysts think its returns will stay flat. And at a 45.1x Uniform P/E, the market expects profitability to increase and is pricing Uniform ROA to be around 40%.
Similarly, Shopify’s (SHOP) Uniform ROA is 17%. Analysts expect its returns will slightly decline to 13%, but the market is more optimistic about the company and pricing its returns to reach 21%.
There’s nothing wrong with investing in expensive companies. The issue is, to keep delivering upside, they need to keep growing. And 2022 was a disastrous year for tech. Many of the companies on this list had to lay off employees, slow down growth, and lower their product prices for the first time in years.
And that just couldn’t sustain these stocks’ sky-high valuations. The ETF lost 59% in the market last year. No wonder it failed to attract investors.
There’s nothing wrong with the way the ETF built its portfolio. It just happened to pick a bad time to invest in tech companies, and it scared investors away as a result.
Assigning a scoring technique might be innovative, but in a turbulent market, investors are looking for something more proven than betting on the next generation.
The market’s already pricing in a profitability improvement for these names and they are trading at much higher valuations than the market’s average. That limits upside potential and may lead to significant downside risk in a volatile market.
Just because this fund failed doesn’t mean Gen Z won’t be an investable theme down the road. Certainly, some of the companies in the top 15 will be around for years to come, and they may very well benefit from Gen Z’s increasing spending power.
This just goes to show the importance of valuation in the investing process. Finding a company with strong profitability and growth is only half of the process. The other, just as important part, is attaching reasonable valuations to the companies and understanding which have upside that has not been fully priced into their current prices.
To see a list of companies that have great performance and stability also at attractive valuations, the Valens Conviction Long Idea List is the place to look. The conviction list is powered by the Valens database, which offers access to full Uniform Accounting metrics for thousands of companies.
Click here to get access.
Read on to see a detailed tearsheet of one of The Generation Z ETF’s largest holdings.
SUMMARY and Enphase Energy, Inc. Tearsheet
As one of The Generation Z ETF’s largest individual stock holdings, we’re highlighting Enphase Energy, Inc. (ENPH:USA) tearsheet today.
As the Uniform Accounting tearsheet for Enphase Energy, Inc. highlights, its Uniform P/E trades at 32.4x, which is above the global corporate average of 18.4x, but below its historical average of 57.5x.
High P/Es require high EPS growth to sustain them. In the case of Enphase Energy, Inc., the company has recently shown 102% Uniform EPS growth.
Wall Street analysts provide stock and valuation recommendations that, in general, provide very poor guidance or insight. However, Wall Street analysts’ near-term earnings forecasts tend to have relevant information.
We take Wall Street forecasts for GAAP earnings and convert them to Uniform earnings forecasts. When we do this, Enphase Energy, Inc.’s Wall Street analyst-driven forecast is for EPS to grow by 35% and 36% in 2023 and 2024, respectively.
Furthermore, the company’s return on assets was 70% in 2022, which is 12x long-run corporate averages. Also, cash flows and cash on hand consistently exceed its total obligations—including debt maturities and CAPEX maintenance. Moreover, its intrinsic credit risk is 90bps above the risk-free rate. Together, these signal low operating risks and low credit risks.
Lastly, Enphase Energy, Inc.’s Uniform earnings growth is above peer averages, and it is in line with peer valuations.
Best regards,
Joel Litman & Rob Spivey
Chief Investment Strategist &
Director of Research
at Valens Research