
This fund almost lost everything, but made a strong comeback

London-based Jupiter Asset Management’s GEAR Fund almost lost everything it had—its assets had fallen more than 90% from 2018 to late 2020.
However, the fund endured this difficult time and made a strong comeback in the last two years as its factor investing strategy started to work very well.
Let’s see the fund through the eyes of Uniform Accounting and evaluate if it can add another year to its winning streak.
In addition to examining the portfolio, we’re including a deeper look into the fund’s largest current holding, providing you with the current Uniform Accounting Performance and Valuation Tearsheet for that company.
Also below, a detailed Uniform Accounting tearsheet of the fund’s largest holding.
Investor Essentials Daily:
Friday Uniform Portfolio Analytics
Powered by Valens Research
Between 2018 and 2020, the stock market was lifted by a rally in big tech companies.
During this time, factor investing had a hard time as quantitative models could not identify profitable factors like value, size, or momentum in these conditions.
As a result, factor investing and many other quantitative strategies were crushed by the market and underperformed the benchmark S&P 500.
As these funds underperformed, investors started to run away, including the Jupiter Merian Global Equity Absolute Return Fund (GEAR) was one of them.
The fund went from $16 billion in net asset value in July 2018 to just $1.3 billion by the end of 2020. It is a loss of more than 90% of the fund’s assets.
However, the fund learned its lesson the hard way, started to change its strategy in late 2020, and made a strong comeback.
Since its inception, the GEAR Fund’s factor investing strategy has been heavily focused on fundamental factors of companies.
With the changing strategy, it weighed down these traditional fundamental factors and added new inputs to its quantitative models.
These new inputs included anything from trading patterns of corporate directors and intel from earnings transcripts to changes in environmental, social, and governance (ESG) ratings.
Thanks to its newly developed factor models and an environment with rising interest rates and historically high inflation levels, the fund’s factor models finally started to work and capture profitable opportunities.
It made 29% in the last two years, while many hedge funds were struggling with uncertainties in the market, global supply chain problems, and crises between Russia and Ukraine. As the GEAR Fund started to enjoy winning against the market, let’s have a look at it using Uniform Accounting and see if it can add one more year to its winning streak in 2023.
Economic productivity is massively misunderstood on Wall Street. This is reflected by the 130+ distortions in the Generally Accepted Accounting Principles (GAAP) that make as-reported results poor representations of real economic productivity.
These distortions include the poor capitalization of R&D, the use of goodwill and intangibles to inflate a company’s asset base, a poor understanding of one-off expense line items, as well as flawed acquisition accounting.
It’s no surprise that once many of these distortions are accounted for, it becomes apparent which companies are in real robust profitability and which may not be as strong of an investment.
See for yourself below.

Looking at as-reported accounting numbers, investors would think that investing in Jupiter GEAR Fund is not really rewarding.
On an as-reported basis, many of the companies in the fund are poor performers. The average as-reported ROA for the top 15 holdings of the fund is 9%, which is below the U.S. corporate average of 12%.
However, once we make Uniform Accounting adjustments to accurately calculate the earning power, we can see that the average return in Jupiter GEAR Fund’s top 15 holdings is actually 30%.
As the distortions from as-reported accounting are removed, we can see that Daito Trust Construction (TSE:1878) isn’t a 6% return business. Its Uniform ROA is 58%.
Meanwhile, HOYA Corporation (TSE:7741) looks like a 14% return business, but this Japanese med-tech company actually powers a 85% Uniform ROA.
To find companies that can deliver alpha beyond the market, just finding companies where as-reported metrics misrepresent a company’s real profitability is insufficient.
To really generate alpha, any investor also needs to identify where the market is significantly undervaluing the company’s potential.
These dislocations demonstrate that most of these firms are in a different financial position than GAAP may make their books appear. But there is another crucial step in the search for alpha. Investors need to also find companies that are performing better than their valuations imply.
Valens has built a systematic process called Embedded Expectations Analysis to help investors get a sense of the future performance already baked into a company’s current stock price. Take a look:
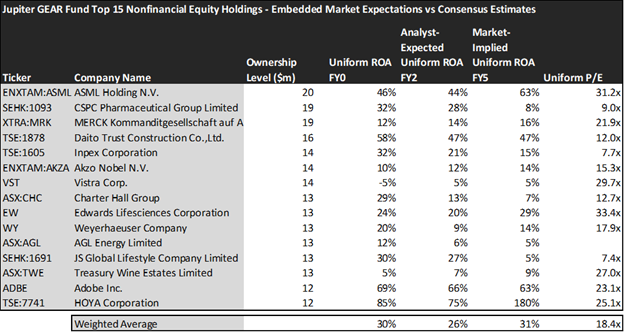
This chart shows four interesting data points:
- The average Uniform ROA among Jupiter GEAR Fund’s top 15 holdings is actually 30% which is much better than the corporate average in the United States.
- The analyst-expected Uniform ROA represents what ROA is forecasted to do over the next two years. To get the ROA value, we take consensus Wall Street estimates and convert them to the Uniform Accounting framework.
- The market-implied Uniform ROA is what the market thinks Uniform ROA is going to be in the three years following the analyst expectations, which for most companies here are 2023, 2024, and 2025. Here, we show the sort of economic productivity a company needs to achieve to justify its current stock price.
- The Uniform P/E is our measure of how expensive a company is relative to its Uniform earnings. For reference, the average Uniform P/E across the investing universe is roughly 20x.
Embedded Expectations Analysis of Jupiter GEAR Fund paints a clear picture. Over the next few years, Wall Street analysts expect the companies in the fund to decline in profitability but the market does not agree with analysts and thinks returns will improve.
Analysts forecast the portfolio holdings on average to see Uniform ROA fall to 26% over the next two years. At current valuations, the market thinks differently from the analysts and expects a 31% Uniform ROA for the companies in the portfolio.
For instance, Edwards Lifesciences Corporation (EW) returned 24% this year. Analysts think its returns will drop to 20%. And at a 33.4x Uniform P/E, the market expects an improvement in profitability and is pricing Uniform ROA to be around 29%.
Similarly, Adobe’s (ADBE) Uniform ROA is 69%. Analysts expect its returns to fall to 66% and the market is pricing its returns to slightly fall to 63%.
Overall, Jupiter GEAR Fund has had a successful two years amid rising inflation and interest rates but the fund’s top holdings show that the market is already pricing in an improvement in profitability for these names. This might disappoint investors as it could lead to some downside risks and its upside could be limited by the market’s expectations. However, investors should analyze carefully and consider the current valuation of the companies they want to invest in before making any investment decision.
This just goes to show the importance of valuation in the investing process. Finding a company with strong profitability and growth is only half of the process. The other, just as important part, is attaching reasonable valuations to the companies and understanding which have upside which has not been fully priced into their current prices.
To see a list of companies that have great performance and stability also at attractive valuations, the Valens Conviction Long Idea List is the place to look. The conviction list is powered by the Valens database, which offers access to full Uniform Accounting metrics for thousands of companies.
Click here to get access.
Read on to see a detailed tearsheet of one of Jupiter GEAR Fund’s largest holdings.
SUMMARY and ASML Holding N.V. Tearsheet
As one of Jupiter GEAR Fund’s largest individual stock holdings, we’re highlighting ASML Holding N.V.’s (ASML:NLD) tearsheet today.
As the Uniform Accounting tearsheet for ASML Holding N.V. highlights, its Uniform P/E trades at 31.2x, which isabove the global corporate average of 18.4x, and around its historical average of 31.6x.
High P/Es require high EPS growth to sustain them. That said, in the case of ASML Holding N.V., the company has recently shown 59% Uniform EPS growth.
Wall Street analysts provide stock and valuation recommendations that, in general, provide very poor guidance or insight. However, Wall Street analysts’ near-term earnings forecasts tend to have relevant information.
We take Wall Street forecasts for GAAP earnings and convert them to Uniform earnings forecasts. When we do this, ASML Holding N.V.’s Wall Street analyst-driven forecast is for EPS to be immaterial in 2022 and grow by 32% in 2023.
Furthermore, the company’s return on assets was 46% in 2021, which is 8x the long-run corporate averages. Also, cash flows and cash on hand consistently exceed its total obligations—including debt maturities and CAPEX maintenance. Moreover, its intrinsic credit risk is 30bps above the risk-free rate. Together, these signal low dividend risks and low credit risks.
Lastly, ASML Holding N.V.’s Uniform earnings growth is below peer averages, and above peer valuations.
Best regards,
Joel Litman & Rob Spivey
Chief Investment Strategist &
Director of Research
at Valens Research


