
This fund manager is calling on the Fed to pivot fast

Nobody’s happy with the Federal Reserve. Folks either think it’s been too lax or too aggressive when it comes to raising interest rates.
Many in the investor community specifically think the Fed has raised rates too much, too fast. However, these criticisms feel like they are biased as rising rates affect their portfolio for better or worse.
One of the comments came recently from Ark Investment Management’s Cathie Wood, suggesting Fed to cut interest rates.
Let’s have a look at ARK Innovation ETF (ARKK) using Uniform Accounting, which is one of the most famous ETF’s from the last decade…
In addition to examining the portfolio, we’re including a deeper look into the fund’s largest current holding, providing you with the current Uniform Accounting Performance and Valuation Tearsheet for that company.
Also below, a detailed Uniform Accounting tearsheet of the fund’s largest holding.
Investor Essentials Daily:
Friday Uniform Portfolio Analytics
Powered by Valens Research
Throughout the year, we saw many fund managers on the mainstream media talking about Fed’s policy and criticizing or complimenting these macroeconomic decisions.
Even though they are just sharing their view, it feels like they’re highly biased because of their funds’ performances.
It’s clear that rising interest rates caused a big hit to the profitability of many funds and investment management companies this year.
The companies that these institutions have been investing in now have an increased cost of capital and less accessibility to credit, which as a result negatively affected their growth and profitability. Thus affecting the performance of the funds as well.
Rising interest rates have also increased the discount rates, which is the interest rate used in discounted cash flow (DCF) analysis to determine the present value of future cash flows.
Among the big losers of this are high-growth companies as their value is highly dependent on their future cash flows and the discount rate.
Now that interest rates are rising, these companies’ access to cheap credit is substantially decreased which could limit their growth significantly.
Recently, Cathie Wood from Ark Investment Management said that this policy could lead to deflation and it resembles the economy in the 1920s, suggesting the Fed to cut rising rates.
Considering the fact that Ark has been affected the most by this policy, her take is clearly in favor of preservation.
Ark’s most famous and largest fund is the ARK Innovation ETF, which heavily invests in high-growth companies.
The ETF lost more than 75% from its 2021 highs when its performance was compared with Warren Buffett’s Berkshire Hathaway.
In this context, let’s take a look at the top holdings of the ETF from the Uniform Accounting perspective and evaluate its performance.
Economic productivity is massively misunderstood on Wall Street. This is reflected by the 130+ distortions in the Generally Accepted Accounting Principles (GAAP) that make as-reported results poor representations of real economic productivity.
These distortions include the poor capitalization of R&D, the use of goodwill and intangibles to inflate a company’s asset base, a poor understanding of one-off expense line items, as well as flawed acquisition accounting.
It’s no surprise that once many of these distortions are accounted for, it becomes apparent which companies are in real robust profitability and which may not be as strong of an investment.
See for yourself below.
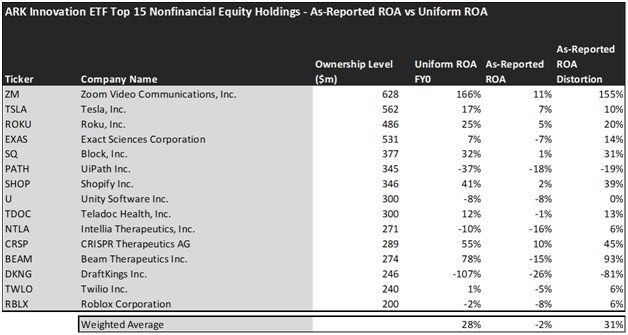
Looking at as-reported accounting numbers, investors would think that ARK Innovation ETF is not profitable at all.
On an as-reported basis, many of the companies in the fund are very bad performers. The average as-reported ROA for the top 15 holdings of the fund is -2%, which is far away from the U.S. corporate average of 12%.
However, once we make Uniform Accounting adjustments to accurately calculate earning power, we can see that the average return in ARK Innovation ETF’s top 15 holdings is actually pretty decent at 28%.
As the distortions from as-reported accounting are removed, we can see that Zoom Video Communications (ZM) isn’t an 11% return business. In fact, its Uniform ROA is 166%.
Meanwhile, Beam Therapeutics (BEAM) looks like it recorded a loss of 15%. This innovative company that engages in gene therapies and genome editing actually powers a 78% Uniform ROA.
To find companies that can deliver alpha beyond the market, just finding companies where as-reported metrics misrepresent a company’s real profitability is insufficient.
To really generate alpha, any investor also needs to identify where the market is significantly undervaluing the company’s potential.
These dislocations demonstrate that most of these firms are in a different financial position than GAAP may make their books appear. But there is another crucial step in the search for alpha. Investors need to also find companies that are performing better than their valuations imply.
Valens has built a systematic process called Embedded Expectations Analysis to help investors get a sense of the future performance already baked into a company’s current stock price. Take a look:
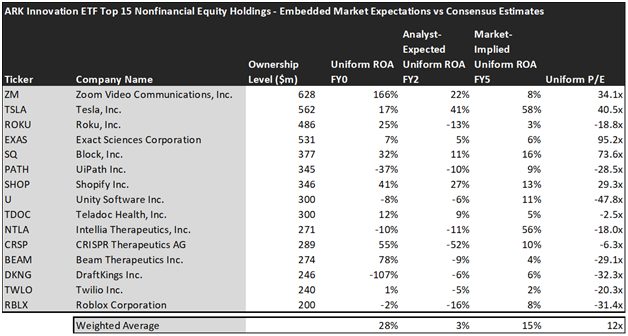
This chart shows four interesting data points:
- The average Uniform ROA among ARK Innovation ETF’s top 15 holdings is actually 28% which is more than double of the corporate average.
- The analyst-expected Uniform ROA represents what ROA is forecasted to do over the next two years. To get the ROA value, we take consensus Wall Street estimates and convert them to the Uniform Accounting framework.
- The market-implied Uniform ROA is what the market thinks Uniform ROA is going to be in the three years following the analyst expectations, which for most companies here are 2023, 2024, and 2025. Here, we show the sort of economic productivity a company needs to achieve to justify its current stock price.
- The Uniform P/E is our measure of how expensive a company is relative to its Uniform earnings. For reference, the average Uniform P/E across the investing universe is roughly 20x.
Embedded Expectations Analysis of ARK Innovation ETF paints a clear picture. Over the next few years, Wall Street analysts expect the companies in the fund to experience a decline in profitability. The market also expects a decline in profitability but it is not that pessimistic compared to the analysts.
Analysts forecast the portfolio holdings on average to see Uniform ROA to hit rock bottom to 3% over the next two years. Meanwhile, the market agrees with the analysts on the decline but expects a 15% Uniform ROA for the companies in ARK Innovation ETF’s portfolio.
For instance, Twilio (TWLO), the programmable communication tools company returned 1% this year. Analysts think its returns will decline and the company will record a -5% Uniform ROA over the next few years. However, the market’s expectation is much greater for the company and is pricing the Uniform ROA to be around 2%.
Similarly, Exact Sciences Corporation’s (EXAS) Uniform ROA is 7%. Analysts are pricing its returns to decline to 5% and the market is pricing its returns to be around 6%.
Overall, we can see that ARK Innovation ETF is heavily focused on disruptive innovation and high-growth companies.
In the current environment where the interest rates are rising and analysts expect the profitability of these companies to fade away, the market is already pricing in their growth, which as a result limits their upside. However, investors need to make a detailed analysis of the valuation of these companies and make investment decisions considering many factors.
This just goes to show the importance of valuation in the investing process. Finding a company with strong profitability and growth is only half of the process. The other, just as important part, is attaching reasonable valuations to the companies and understanding which have upside which has not been fully priced into their current prices.
To see a list of companies that have great performance and stability also at attractive valuations, the Valens Conviction Long Idea List is the place to look. The conviction list is powered by the Valens database, which offers access to full Uniform Accounting metrics for thousands of companies.
Click here to get access.
Read on to see a detailed tearsheet of one of ARK Innovation ETF’s largest holdings.
SUMMARY and Zoom Video Communications, Inc. Tearsheet
As one of ARK Innovation ETF’s largest individual stock holdings, we’re highlighting Zoom Video Communications, Inc.’s (ZM:USA) tearsheet today.
As the Uniform Accounting tearsheet for Zoom Video Communications, Inc. highlights, its Uniform P/E trades at 34.1x, which is above the global corporate average of 18.4x, but below its historical average of 40.8x.
High P/Es require high EPS growth to sustain them. In the case of Zoom Video Communications, Inc., the company has recently shown 56% Uniform EPS growth.
Wall Street analysts provide stock and valuation recommendations that, in general, provide very poor guidance or insight. However, Wall Street analysts’ near-term earnings forecasts tend to have relevant information.
We take Wall Street forecasts for GAAP earnings and convert them to Uniform earnings forecasts. When we do this, Zoom Video Communications, Inc.’s Wall Street analyst-driven forecast is for EPS to shrink by 57% and 33% in 2023 and 2024, respectively.
Furthermore, the company’s return on assets was 166% in 2022, which is 28x the long-run corporate averages. Also, cash flows and cash on hand consistently exceed its total obligations—including debt maturities and CAPEX maintenance. Moreover, its intrinsic credit risk is 90bps above the risk-free rate. Together, these signal low operating risks and low credit risks.
Lastly, Zoom Video Communications, Inc.’s Uniform earnings growth is below peer averages, and above peer valuations.
Best regards,
Joel Litman & Rob Spivey
Chief Investment Strategist &
Director of Research
at Valens Research