
With the general slowdown for growth funds, let’s check in on one of the best

The last 13 years up until late 2021 were some of the best years for growth stocks in the past century. Low interest rates and asset-light business models that could scale for massive potential footprints meant growth opportunities were the apple of investors’ eyes.
However, one fund group had been focusing on growth names for much longer beforehand. Furthermore, they had a systematic approach unlike many of the new growth adoptees drawn in thanks to attractive market conditions.
As an expert in successfully picking growth names, Richard Driehaus has been one of the most influential fund managers focusing on growth investments. Today, we are going to evaluate the Driehaus Small/Mid Cap Growth Fund using Uniform Accounting.
In addition to examining the portfolio, we’re including a deeper look into the fund’s largest current holding, providing you with the current Uniform Accounting Performance and Valuation Tearsheet for that company.
Also below, a detailed Uniform Accounting tearsheet of the fund’s largest holding.
Investor Essentials Daily:
Friday Uniform Portfolio Analytics
Powered by Valens Research
Richard Driehaus was named on Barron’s “All-Century” team of 25 individuals who have been among the most influential people within the investment industry over the past 100 years.
That shows how much influence and effort he had given to the investment industry.
He is also known as the father of momentum investing, which stands for choosing stocks on prolonged upward trends.
Being a highly successful professional in picking growth stocks and catching the momentum trend, Driehaus has managed to deliver compound annual returns of 30% for 12 years since he formed Driehaus Capital Management in 1982.
I had the pleasure to teach alongside Richard Driehaus at DePaul University before he sadly passed away. I greatly respect the man and the mark he left on the investing world.
Today, we are going to a new fund we haven’t talked about before under the Driehaus umbrella. Below, you will find our original report on the company alongside an updated portfolio overview and analysis.
———————————————————————————————————————————–
When Mark Cuban bought the Dallas Mavericks on January 4, 2000, the team had had a 240-550 record the prior 10 years.
Through the entire 1990s, the team went to the playoffs once, in 1990. They lost all 3 games in that playoff series. Mavericks fans had not seen a playoff win in over a decade when Cuban bought the team.
And yet, Cuban paid an eye watering $285 million for the franchise. At the time, no one had ever bought an NBA franchise for more than $200 million. His acquisition raised more than a few eyebrows.
Who buys one of the most poorly run franchises in the league, in a football town, for 40%+ more than anyone had ever paid for another NBA team?
But Cuban understood something important.
The Mavericks’ worth had nothing to do with their record the past 10 years. What would matter is the potential growth drivers he could unlock in the business going forward.
That would determine whether he was overpaying for a trophy asset, or he was as savvy with this purchase as he had been in building Broadcast.com and selling it to Yahoo for $5 billion.
Cuban was an avid basketball fan. He had courtside seats next to the Mavericks bench before he ever became an owner. He had done his research. He could see opportunities to unlock, to justify the value of his investment.
He saw where he would drive growth in the business, and how he could make a significant return on his investment. He was confident in betting on growth when others were just focusing on valuing the business as it was.
He started by focusing on filling up the arena. He sold seats in the nosebleeds for $8 a game to get people in the door. He knew he’d make up the money on concessions. He raised the high demand courtside seat prices 10x, from $200 a seat to $2,000. People still came, they wanted to be on TV.
Importantly, he also invested in the team itself. The way to make real money on the team wasn’t to starve the product and wait to make money on the broadcasting and ticket sales as they stood today, it was to drive growth in all sides of the business by investing to facilitate that growth.
The team had a core of Steve Nash and Dirk Nowitzki, who had both joined the team prior to Cuban buying the team. He surrounded them with the players they needed. When the team needed rebounding, he brought in Dennis Rodman, the seven-time NBA rebounding champion.
His investment yielded a return on the court. The following 10 years, the Mavericks didn’t have a losing season. They won the NBA championship in 2011. But just as importantly, his investment benefited the business’ ability to throw off revenue.
He also had great timing. Cuban purchased the team just when the industry he had made his money in, media and the internet, were making the league more international. They were also making overall fan engagement in the league stronger.
This meant bigger broadcasting deals, and new lines of revenue for the league as a whole. Lines of revenue that would trickle down to the Mavericks.
Cuban’s focus on investing in growth in the business, and his timing in riding a macro wave have led to the Mavericks value rising to $2.3 billion today, according to Forbes. That’s a 7x+ return for Cuban from his investment 19 years ago.
That is the kind of return you only can generate if you are comfortable betting on growth.
Buying a value stock, a company that is trading at 50% of its intrinsic value, can lead to a stock doubling. But it’s almost impossible to find a company that is intrinsically undervalued 7x what it is worth, based on current cash flows.
Only by finding investments that can transform their cash flows, can one generate 7x returns.
Few investors have a more impressive track record finding growth investments than Richard Driehaus. For context, in the 1980s, a dollar invested in the Russell 2000 would have turned into $4.65. For Driehaus’s fund, that same $1 would have turned into $24.65. That’s a 5x higher return.
His fund has kept on producing returns like those since.
After Driehaus read John Herold’s America’s Fastest Growing Companies, he’d embraced the idea that the best way to find companies that could massively outperform was to find companies who could grow.
As Driehaus himself said:
“One market paradigm that I take exception to is: buy low and sell high. I believe far more money is made by buying high and selling at even higher prices.”
Driehaus never troubled himself with P/Es. If a P/E is high, but the earnings growth means the company can deliver, and already is showing strong results, his fund will jump in.
He didn’t spend his time understanding what the company is worth and if it’s intrinsically undervalued. He focuses on if the company has positive operating momentum, and the ability to drive growth that can look like Cuban’s 7x return… or more.
Said differently:
“I believe you make the most money by hitting home runs, not just a lot of singles.”
Driehaus understood, and his firm still understands, that traditional valuation metrics, and the traditional valuation process for those who use as-reported accounting metrics, is deeply flawed. And so they focus on identifying companies that those methodologies have missed.
One of Driehaus Capital’s newer funds is the Driehaus Small/Mid Cap Growth Fund. While as-reported methodologies may distort these companies’ performance, looking at Uniform Accounting analysis can start to unlock the power of Driehaus’s strategy.
To show what we mean, we’ve done a high level portfolio audit of the Small/Mid Cap Growth Fund’s current portfolio, based on their most recent 13-F. This is a very light version of the custom portfolio audit we do for our institutional clients when we analyze their portfolios for torpedos and companies they may want to “lean in” on.
See for yourself below.
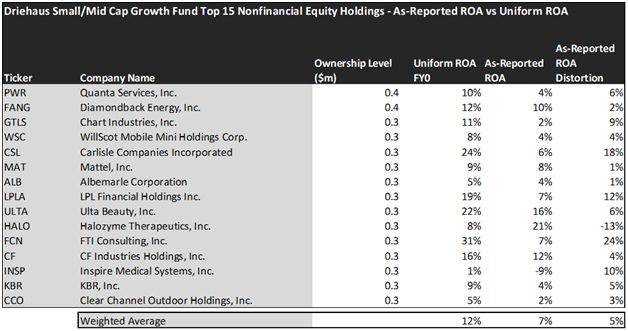
Using as-reported accounting, investors would think investing with Driehaus is not that profitable.
On an as-reported basis, many of these companies are poor performers in terms of profitability and operating with an average as-reported ROA of just 7% which equates to below corporate averages in the United States.
However, once we make Uniform Accounting (UAFRS) adjustments to accurately calculate earning power, we can see that the returns of the companies in the Driehaus Small/Mid Cap Growth Fund are much more robust.
The average company in the portfolio displays an average Uniform ROA of 12%, which is slightly above the corporate average returns.
Once the distortions from as-reported accounting are removed, we can realize that Carlisle Companies (CSL) doesn’t have a ROA of 6%, but returns of 24%.
Similarly, LPL Financial Holdings (LPLA) ROA is actually 19%, not 7%. LPL Financial is a highly successful company, it is a leader in the retail financial advice market and the nation’s largest independent broker/dealer.
FTI Consulting (FCN) is another great example of as-reported metrics misrepresenting the company’s profitability. With a Uniform ROA of 31%, an as-reported of 7% is wholly misleading and misses the story.
If investors were to look at the fund as powered by as-reported metrics, they would think that Driehaus’ strategies are not as successful and influential as it seems.
To find companies that can deliver alpha beyond the market, just finding companies where as-reported metrics misrepresent a company’s real profitability is insufficient.
To really generate alpha, any investor also needs to identify where the market is significantly undervaluing the company’s potential.
When distortions from as-reported metrics are removed, investors can see that Driehaus is actually doing a great job and they are highly successful. However, investors shouldn’t jump into the fund without considering the upside potential of such an investment.
Once we account for Uniform Accounting adjustments, we can see that many of these companies are strong stocks but have already realized most of their potential.
These dislocations demonstrate that most of these firms are in a different financial position than GAAP may make their books appear. But there is another crucial step in the search for alpha. Investors need to also find companies that are performing better than their valuations imply.
Valens has built a systematic process called Embedded Expectations Analysis to help investors get a sense of the future performance already baked into a company’s current stock price. Take a look:
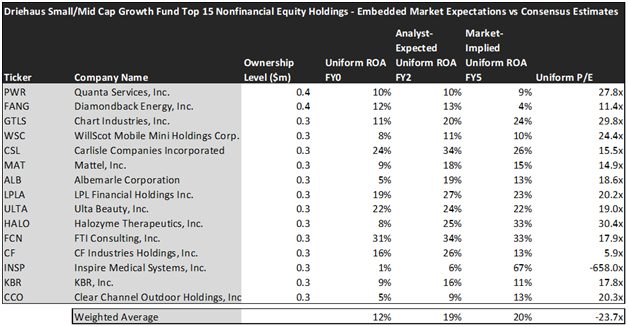
This chart shows four interesting data points:
- The Uniform ROA FY0 represents the company’s current return on assets, which is a crucial benchmark for contextualizing expectations.
- The analyst-expected Uniform ROA represents what ROA is forecasted to do over the next two years. To get the ROA value, we take consensus Wall Street estimates and convert them to the Uniform Accounting framework.
- The market-implied Uniform ROA is what the market thinks Uniform ROA is going to be in the three years following the analyst expectations, which for most companies here is 2023, 2024, and 2025. Here, we show the sort of economic productivity a company needs to achieve to justify its current stock price.
- The Uniform P/E is our measure of how expensive a company is relative to its Uniform earnings. For reference, the average Uniform P/E across the investing universe is roughly 24x.
Embedded Expectations Analysis of Driehaus Small/Mid Cap Growth Fund paints a clear picture for investors. As the stocks it tracks are strong performers historically, the markets are pricing them to increase in profitability, while analysts seem to agree with the market.
While analysts forecast the fund to see Uniform ROA increase to 19% over the next two years, the market is also pricing the fund to see returns increase to 20%, almost the same levels as analysts. This would imply the fund is on average being correctly priced in by the market.
However, there are a couple of companies that may lead investors to be cautious.
The markets are pricing in Inspire Medical Systems (INSP) Uniform ROA to rise to 67%. Meanwhile, analysts are projecting the company’s returns to slightly increase to 6%.
Halozyme Therapeutics (HALO) may further disappoint investors as their returns are expected to increase to 25% Uniform ROA, while the market expects them to increase their returns to 33%.
Overall, the portfolio reflects the growth opportunities and high profitability the fund aimed at. However, the risk that comes with high growth should not be underestimated.
To sum up, the portfolio is composed of strong performers and high-growth names that can deliver impressive returns, but investors should carefully analyze the current investment environment and valuations before making a strategic decision.
This just goes to show the importance of valuation in the investing process. Finding a company with strong growth is only half of the process. The other, just as important part, is attaching reasonable valuations to the companies and understanding which have upside which have not been fully priced into their current prices.
To see a list of companies that have great performance and stability also at attractive valuations, the Valens Conviction Long Idea List is the place to look. The conviction list is powered by the Valens database, which offers access to full Uniform Accounting metrics for thousands of companies.
Click here to get access.
Read on to see a detailed tearsheet of the fund’s largest holdings.
SUMMARY and Quanta Services, Inc. Tearsheet
As Driehaus’ largest individual stock holding, we’re highlighting Quanta Services, Inc. (PWR:USA) tearsheet today.
As the Uniform Accounting tearsheet for Quanta Services highlights, its Uniform P/E trades at 27.8x, which is above the global corporate average and its historical average of 19.7x.
High P/Es require high EPS growth to sustain them. In the case of Quanta Services, the company has recently shown 37% Uniform EPS growth.
Wall Street analysts provide stock and valuation recommendations that, in general, provide very poor guidance or insight. However, Wall Street analysts’ near-term earnings forecasts tend to have relevant information.
We take Wall Street forecasts for GAAP earnings and convert them to Uniform earnings forecasts. When we do this, Quanta Services’ Wall Street analyst-driven forecast is for EPS to grow by 9% and 24% in 2022 and 2023, respectively.
Based on the current stock market valuations, we can use earnings growth valuation metrics to back into the required growth rate to justify Quanta Services’ $132 stock price. These are often referred to as market embedded expectations.
The company is currently being valued as if Uniform earnings were to grow by 25% annually over the next three years. What Wall Street analysts expect for Quanta Services’ earnings growth is below what the current stock market valuation requires through 2023.
Meanwhile, the company’s earning power is 2x the long-run corporate averages. Also, cash flows and cash on hand are greater than the total obligations—including debt maturities and capex maintenance. However, intrinsic credit risk is 120bps. All in all, these signal low dividend risk and moderate credit risk.
Lastly, Quanta Services’ Uniform earnings growth is below peer averages, but is trading above its average peer valuations.
Best regards,
Joel Litman & Rob Spivey
Chief Investment Strategist &
Director of Research
at Valens Research


