
Get Big or Die Trying

The local news business has been steadily under pressure for the past 5+ years, and really for some time before that. Data from MoffettNathanson shows that pay TV subscribers are shrinking.
Viewership for local broadcasts in particular are far more popular for retirees than millennials. The younger generation get much of their news online, and unplugging from the cable box is a trend that is only going to accelerate.
There’s a reason there has been a wave of consolidation for content providers themselves, and television networks, over the past several years. As overall “eyeballs” watching shrink, it means stations and companies without a broad base to draw from are likely to struggle.
For broadcasting companies in particular, scale is powerful in several ways. Scale inside a market is powerful, because it lets the company combine stations and reduce costs. Many of the larger broadcast station companies who have multiple stations in the same market will have them share the same studios, and even the same news, to significantly reduce costs versus having two standalone stations. Retransmission fees don’t decline, but the cost to produce news does.
Also, some of the larger broadcast station companies lower cost by having some segments produced centrally. Sinclair has been one of the companies to have done this.
One of the companies that have had the most success in consolidating and scaling their business to defend it is Tegna (TGNA).
Tegna was created after Gannett spun off their newspaper assets in 2015. Before and after the spin-off, the company had been steadily acquiring TV assets. With the company’s Nexstar/Tribune station acquisitions the company is now the largest Big 4 affiliate in the top 25 markets in the US, and has 62 stations in total.
They’ve used their scale to reduce costs and improve efficiencies in the business. They’ve also been tactical in their growth, focusing on areas where they anticipate secular growth in political spending that boosts their profitability every 2 years.
The company has also leveraged their size when they negotiate fees, and advertising solutions for streaming partners that offer their stations. They’ve been able to use their scale and investments in streaming advertising solutions to become a significant player in this space.
Their successful focus on using their scale to help facilitate their strategy had led adjusted ROA to expand from 6% in 2013 to 24% in 2018. This has been a very successful strategy.
The market doesn’t believe this can continue. The market believes that the risks around reduced viewership and lower advertising revenue and therefore lower retransmission fees means returns are going to crater, and Tegna is being priced for that to happen.
However, management is showing confidence about their strategies to sustain their returns through cost cutting strategies, and the potential for their M&A strategies to help give them scale to sustain revenue strength. Considering low market expectations and the company’s strong fundamentals, the market may have Tegna wrong.
We’re Relaunching Our Portfolio Audit Review Offering – And Making A Special Offer
For our institutional clients, we don’t just provide access to our Valens Research app. We also do bespoke research. We produce one-off deep-dive company analyses using all our tools, including Uniform Accounting, credit work, and our management compensation and earnings call analysis. We monitor their portfolios for potential Uniform Accounting signals to alert them. We provide custom datasets for quantitative analysis, and provide aggregate analytics. We also help them create unique idea generation screens that are customized to their approach, using Uniform Accounting and our other analytics.
But for most of our institutional clients, the analysis that they find most useful, and almost universally ask for, is a quarterly portfolio audit and call with our analysts.
Our institutional clients pay a significant premium for all our bespoke research. Some of our institutional clients have paid well over $100,000 a year for our uniquely tailored Uniform Accounting research, because of the value it adds to their process.
Until Thanksgiving, we’re making a special offer.
For any investor that buys access to the Valens Research app ($10,000/year subscription), we will include an Institutional-level portfolio audit and call with our analyst team with no extra charge.
Also, for those people who sign up to the offer before end of day on November 15th, we’ll include one year of access to all of our newsletters, including our Market Phase Cycle™ and Conviction Long Idea List (a $6,000 value), for no extra charge.
We want to help show you how powerful Uniform Accounting research can be for your investment strategy.
If you want to hear more about this offer, or are interested in subscribing, feel free to reply to this email. I’ll forward your note to our head of client servicing. Or, feel free to reach out to Doug Haddad, the head of our client relations team, at doug.haddad@valens-securities.com or at 630-841-0683.
To read more about the offer and sign up, you can also click here.
Markets are pricing in expectations for Uniform ROA to fall, but management is confident about their M&A strategy and costs
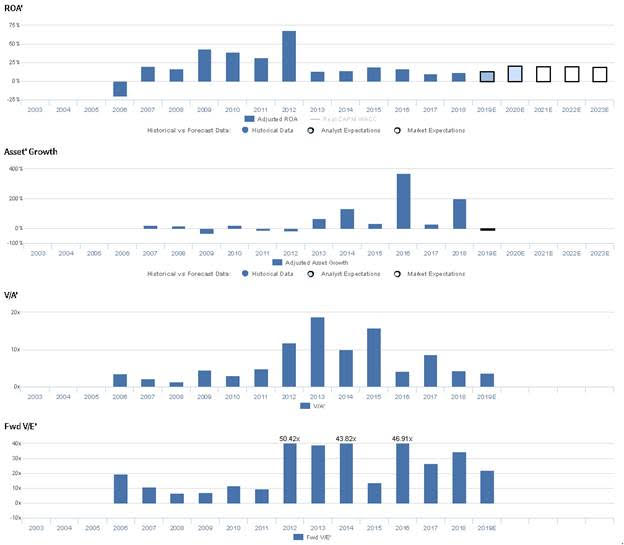
TGNA currently trades below corporate averages relative to UAFRS-based (Uniform) Earnings, with a 12.0x Uniform P/E. At these valuations, the market is pricing in expectations for Uniform ROA to fall from 24% in 2018 to 14% by 2023, accompanied by immaterial Uniform Asset growth going forward.
However, analysts have bullish expectations, projecting Uniform ROA to improve to 25% by 2020, accompanied by 1% Uniform Asset shrinkage.
TGNA has historically seen somewhat cyclical profitability, with Uniform ROA falling from 31% in 2003 to 13% in 2008, before inflecting to 18% in 2009. Subsequently, Uniform ROA fell to lows of 6% in 2013, and improved to 24% in 2018, excluding 10% underperformance in 2016. Meanwhile, Uniform Asset growth has been fairly volatile, positive in five of the past 16 years, ranging from -57% to 101%, the former driven by the firm’s spin off from the Gannet Company.
Performance Drivers – Sales, Margins, and Turns
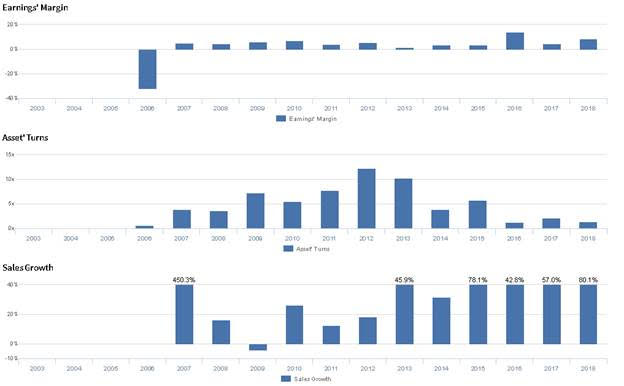
Cyclicality in Uniform ROA has been driven primarily by offsetting trends in Uniform Earnings Margin and Uniform Asset Turns. Uniform Margins fell from 19% in 2003 to 9% in 2008, before improving to 15% in 2010. Thereafter, Uniform Margins fell to 6% in 2013, before climbing to 28% in 2016, declining to 24% in 2017, and reversing to 27% in 2018. Meanwhile, Uniform sustained 1.6x levels from 2003 to 2006, before steadily declining to 0.4x in 2016, and improving to 0.8x levels in 2017-2018. At current valuations, markets are pricing in expectations for a reversal in recent Uniform Margin improvements, coupled with stability in Uniform Turns.
Earnings Call Forensics
Valens’ qualitative analysis of the firm’s Q2 2019 earnings call highlights that management is confident their M&A strategy will continue to position the firm for success and that their dispatch acquisition gives them TV coverage to two thirds of all Ohio homes. Furthermore, they are confident their acquired stations help reduce their cost base, and they are confident in their ability to continue their M&A program.
However, they may be concerned about the timing of their national sales force transformation, and they may lack confidence in their ability to meet subscription count guidance. Finally, they may lack confidence in their ability to refinance their existing debt at a favorable rate.
UAFRS VS As-Reported

Uniform Accounting metrics also highlight a significantly different fundamental picture for TGNA than as-reported metrics reflect. As-reported metrics can lead investors to view a company to be dramatically stronger or weaker than real operating fundamentals highlight. Understanding where these distortions occur can help explain why market expectations for the company may be divergent.
As-reported metrics significantly understate TGNA’s ROA. For example, as-reported ROA for TGNA was 9% in 2018, substantially lower than Uniform ROA of 24%, making TGNA appear to be a much weaker business than real economic metrics highlight. Moreover, as-reported ROA has been substantially lower than Uniform ROA in each year since 2003, misleading investors to believe that TGNA has a much lower ROA floor than is accurate.
Today’s Tearsheet
Today’s tearsheet is for LVMH. LVMH trades at a premium to market valuations. At current valuations, the market is pricing in Uniform EPS to grow steadily; however, the company is actually forecast to have EPS grow significantly more the next two years, and they’ve grown more robustly previously. The company’s earnings growth is at the high end of peers, while the company is trading at average valuations relative to peers. The company has robust profitability and no risk to their dividend.
Regards,
Joel Litman
Chief Investment Strategist