
Hedge Fund Investments and M&A Activity Vitalized the Biotech Industry

The biotech industry has been suffering in the stock market for around a year and a half. Its value almost halved from its highs in February 2021. But new drug approvals, an uptick in M&A activity, and investments from some high-profile healthcare hedge funds helped the industry gain back a small portion of what it lost.
Today, we are going to have a look at the SPDR S&P Biotech ETF (XBI), one of the most popular ways to be exposed to the biotech industry, from a Uniform Accounting perspective. We will examine whether this recent rally is a sign of things to come, or if investors are catching a falling knife.
In addition to examining the portfolio, we’re including a deeper look into the fund’s largest current holding, providing you with the current Uniform Accounting Performance and Valuation Tearsheet for that company.
Also below, a detailed Uniform Accounting tearsheet of the fund’s largest holding.
Investor Essentials Daily:
Friday Uniform Portfolio Analytics
Powered by Valens Research
Biotech companies research and develop drugs, typically in years-long processes, but they have a huge potential when they develop successful treatments.
That is why compared to many industries, the biotech sector was among the biggest beneficiaries of the pandemic.
However, as the pandemic started to fade away from our lives and the world went back to normal, the biotech industry started to give up its large gains.
On top of that, rising interest rates hurt biotech companies, as most biotech products require high future investment, making their products more expensive to finance.
As a result, SPDR S&P Biotech ETF (XBI) almost halved in 2022. Compared with the rest of the market, the sector had the lowest year-to-date performance excluding communications.
But a recent uptick in M&A activity, developments in new drug approvals, and investments from some high-profile healthcare hedge funds are helping the sector to bounce back.
In addition to these fundamental drivers, the uncertainty over Medicare drug pricing was replaced with certainty on what the price controls would look like. This has encouraged investors to jump back into the biotech industry.
Right now, the SPDR S&P Biotech ETF is up around 35% from its lows in May, and investors are wondering if they missed a buying opportunity, or if this is just a dead cat bounce.
Let’s look at the XBI ETF through Uniform Accounting lenses to see if the sector is compelling or not.
Economic productivity is massively misunderstood on Wall Street. This is reflected by the 130+ distortions in the Generally Accepted Accounting Principles (GAAP) that make as-reported results poor representations of real economic productivity.
These distortions include the poor capitalization of R&D, the use of goodwill and intangibles to inflate a company’s asset base, a poor understanding of one-off expense line items, as well as flawed acquisition accounting.
It is no surprise that once many of these distortions are accounted for, it becomes apparent which companies are in real robust profitability and which may not be as strong of an investment.
See for yourself below.
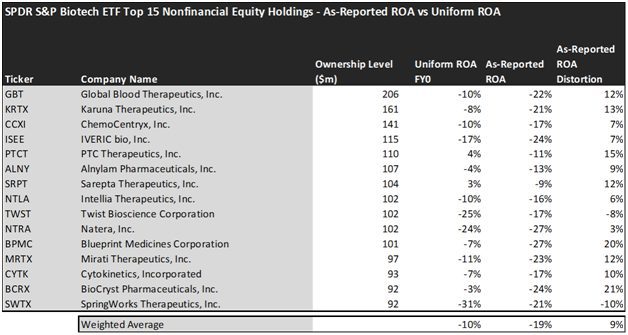
Using as-reported accounting, investors would think investing in the biotech sector is not really rewarding at all.
On an as-reported basis, many of these companies are poor performers in terms of profitability and operate with an average as-reported ROA of -19%, which is way below the corporate averages in the United States of 12%.
Once we make Uniform Accounting (UAFRS) adjustments to accurately calculate earning power, we can see that the returns of the companies in SPDR S&P Biotech ETF are slightly better.
The average company in the portfolio displays a Uniform ROA of -10%, which is approximately two times better than what as-reported metrics are showing.
Once the distortions from as-reported accounting are removed, we can realize that Blueprint Medicines Corporation (BPMC) doesn’t have -27% returns, but a Uniform ROA of -7%.
Similarly, PTC Therapeutics, Inc. (PTCT) ROA is actually 4%, not -11%. PTC Therapeutics is a US pharmaceutical company focused on the development of orally administered small molecule drugs and gene therapy which regulate gene expression by targeting post-transcriptional control mechanisms in orphan diseases.
Intellia Therapeutics (NTLA) is another great example of as-reported metrics misrepresenting the company’s profitability. With a Uniform ROA of -10%, an as-reported of -16% is misleading investors.
To find companies that can deliver alpha beyond the market, just finding companies where as-reported metrics misrepresent a company’s real profitability is insufficient.
To really generate alpha, any investor also needs to identify where the market is significantly undervaluing the company’s potential.
These dislocations demonstrate that most of these firms are in a different financial position than GAAP may make their books appear. But there is another crucial step in the search for alpha. Investors need to also find companies that are performing better than their valuations imply.
Valens has built a systematic process called Embedded Expectations Analysis to help investors get a sense of the future performance already baked into a company’s current stock price. Take a look:
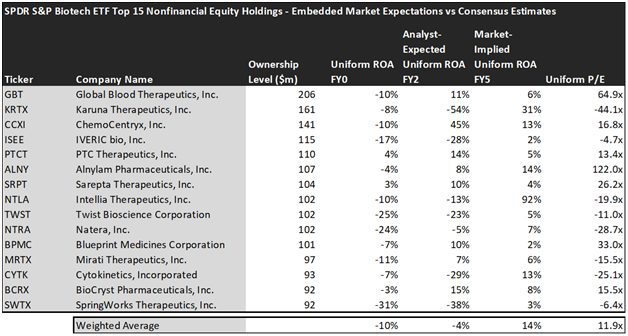
This chart shows four interesting data points:
- The Uniform ROA FY0 represents the company’s current return on assets, which is a crucial benchmark for contextualizing expectations.
- The analyst-expected Uniform ROA represents what ROA is forecasted to do over the next two years. To get the ROA value, we take consensus Wall Street estimates and convert them to the Uniform Accounting framework.
- The market-implied Uniform ROA is what the market thinks Uniform ROA is going to be in the three years following the analyst expectations, which for most companies here are 2023, 2024, and 2025. Here, we show the sort of economic productivity a company needs to achieve to justify its current stock price.
- The Uniform P/E is our measure of how expensive a company is relative to its Uniform earnings. For reference, the average Uniform P/E across the investing universe is roughly 20x.
Embedded Expectations Analysis of SPDR S&P Biotech ETF paints a clear picture. Over the next few years, Wall Street analysts expect the companies in XBI ETF to slightly improve in profitability, while the market is much more optimistic and pricing in a significant increase in profitability.
Analysts forecast the industry to see Uniform ROA slightly increase to -4% over the next two years, and the market is pricing the industry to see returns rise to 14%, which implies a large downside risk for the sector as investors are much too optimistic.
A couple of companies may lead investors to be especially cautious.
The markets are expecting Karuna Therapeutics’s (KRTX) Uniform ROA to rise to 31%. Meanwhile, analysts are projecting the company’s returns to decline to -54%, perhaps disappointing investors.
SpringWorks Therapeutics (SWTX), may further disappoint investors. Analysts expect its returns to fade from -31% to -38%, while the market expects Uniform ROA to improve to 3%.
For investors that want to be exposed to the biotech industry SPDR S&P Biotech ETF looks like a good option overall. The ETF’s holdings consist of companies that have high growth potential. However, before making any investment decisions, investors should look out for the valuations of the companies.
This just goes to show the importance of valuation in the investing process. Finding a company with strong growth is only half of the process. The other, just as important part, is attaching reasonable valuations to the companies and understanding which have upside which has not been fully priced into their current prices.
To see a list of companies that have great performance and stability also at attractive valuations, the Valens Conviction Long Idea List is the place to look. The conviction list is powered by the Valens database, which offers access to full Uniform Accounting metrics for thousands of companies.
Click here to get access.
Read on to see a detailed tearsheet of one of SPDR S&P Biotech ETF’s largest holdings.
SUMMARY and Global Blood Therapeutics, Inc. Tearsheet
As one of XBI’s largest individual stock holdings, we’re highlighting Global Blood Therapeutics, Inc. (GBT:USA) tearsheet today.
As the Uniform Accounting tearsheet for Global Blood Therapeutics highlights, its Uniform P/E trades at 64.9x, which is above the global corporate average of 19.3x, and its historical average of -22.8x.
Low P/Es require low EPS growth to sustain them. That said, in the case of Global Blood Therapeutics, the company has recently shown 1% Uniform EPS shrinkage.
Wall Street analysts provide stock and valuation recommendations that, in general, provide very poor guidance or insight. However, Wall Street analysts’ near-term earnings forecasts tend to have relevant information.
We take Wall Street forecasts for GAAP earnings and convert them to Uniform earnings forecasts. When we do this, Global Blood Therapeutics’ Wall Street analyst-driven forecast is for EPS to shrink by 50% and 396% in 2022 and 2023, respectively.
Furthermore, the company’s return on assets was -10% in 2021, which is below the long-run corporate averages. Also, cash flows and cash on hand are exceeds its total obligations—including debt maturities and CAPEX maintenance. Moreover, its intrinsic credit risk is 80bps above the risk-free rate. Together, these signal low credit risks.
Lastly, Global Blood Therapeutics’s Uniform earnings growth is below peer averages, and trading in above peer valuations.
Best regards,
Joel Litman & Rob Spivey
Chief Investment Strategist &
Director of Research
at Valens Research