
A hedge fund legend passed away, but his legacy will live on

Julian Robertson passed away last month. He was truly a legend in the hedge fund and investment management industry, creating the structure of the hedge fund we recognize today.
Since he closed down the original Tiger fund group at the turn of the century, countless former employees opened their own shops and took their place among the well-respected funds.
Today, we are going to evaluate the most successful and largest of the Tiger Cubs, Chase Coleman and his Tiger Global, using Uniform Accounting.
In addition to examining the portfolio, we’re including a deeper look into the fund’s largest current holding, providing you with the current Uniform Accounting Performance and Valuation Tearsheet for that company.
Also below, a detailed Uniform Accounting tearsheet of the fund’s largest holding.
Investor Essentials Daily:
Friday Uniform Portfolio Analytics
Powered by Valens Research
When I (Rob) first started to fall in love with investing in the mid-2000s, there was one investor whose story really resonated with me the most. It was Julian Robertson.
At this point, the Tiger Cubs hadn’t all taken off like they had the past 15 years. They were building a small but impressive clique around the greatness of Robertson.
He was a passionate investor in deep fundamental research and believed that if you truly found which companies were the best and worst, and hold them over time, you would win.
He crushed the market for a long time, but then he called the crash too early in the late 1990s and was forced to close his doors.
But he kept his own money invested in the shorts and the longs, and in short order, he was proven correct.
He learned two things from being right too early. First, it’s not just valuation that is vital, but themes and timing as well. He also knew that at the end of the day, deep fundamental research worked in the long run no matter what.
Learning his investment strategy, how to learn from his mistakes, and how he then was able to teach others to build their own firms that he seeded, and continue to foster a team to do that, all to me was not just instructive, it was inspirational.
And so it is with a heavy heart that I write this as he passed away late last month. In his memory, we’d like to run the story we wrote about Robertson as one of our original articles when we first launched our daily newsletter almost 3 years ago, along with an up-to-date analysis of Tiger Global.
In March 2000, Julian Robertson made the decision to return all Tiger Management’s investors’ money. He shut down the hedge fund.
One of Tiger’s funds, the Jaguar Fund, had dropped 14% in the first 2 months of the year, having lost almost 18% since late 1998. After a $2 billion loss on a bad bet in the Japanese yen in 1998, Tiger had steadily seen investors leaving, and taking on losses, seeing the firm’s AUM drop from $20 billion in 1998 to $6.5 billion at the time Robertson decided to close the doors.
Robertson and Tiger had been one of the early stars of the hedge fund world. He took $8 million in capital in 1980 and turned it into over $20 billion by the fund’s 1998 peak.
But Robertson was too early to the party of shorting internet stocks. His dogmatic value-based philosophy on investing led him to be long old-economy company in the late 1990s, in the face of a rampant growth-focused bull market.
It meant that when he reached his peak in AUM, that was just when he started losing money. And because of that timing, many have said he actually lost more money for investors than he ever made them in the prior 18 years.
Ironically, March 2000, when Tiger threw in the towel, was the market peak, and Robertson ended up being proven right.
He made plenty of money after 2000, as he remained short the internet bubble with his own money, but his investors never got to participate.
But that’s not the most important thing that came out of Tiger Management. The most important thing was the group of investors that Robertson mentored at Tiger, and sponsored to grow after Tiger’s demise.
He had built an all-star team at Tiger. They matured under him at Tiger, absorbing his deep fundamental research perspective. Importantly, with his help, they also learned his mistakes in the dot-com bubble, and understood the importance of timing their investments to avoid being right too soon as Robertson had been.
In the aftermath of the dot-com bubble, Robertson sponsored several of his former employees setting up their own hedge funds. He would provide them with initial capital for a stake in their fund. He would continue to mentor them. And he would help them create a network of Tiger Cubs, that would share ideas and research, much like they had inside of Tiger Management, to maximize returns.
These great investors include brand names like Samlyn, Maverick, Lone Pine, HealthCor, and Coatue. Hedge funds that are amongst the most respected investors today.
Most would agree the most successful, and largest, of the tiger cubs is Chase Coleman and his Tiger Global.
Coleman and Tiger Global follow in Robertson’s fundamental research-driven footsteps. Their strategy is not as simple as focusing just on value companies, like Klarman at Baupost, or growth companies, like Driehaus. Their goal is to find great thematic ideas that are mispriced by the market, which can run the gamut of deep value, value, GARP, and growth names, depending on the market context.
When looking at Tiger Global’s holdings, anyone using as-reported accounting metrics would likely be scratching their heads.
Coleman and his firm are focused on the true fundamentals of companies when they are looking for mispriced firms. Using traditional as-reported accounting metrics, the fundamentals and KPIs for businesses don’t line up with the accounting. It is only once those holdings are looked at with a lens that better represents economic reality, and lines up with the KPIs and real fundamentals, that their investments become apparent.
To show what we mean, we’ve done another high-level portfolio audit of Tiger Global’s top holdings, based on their most recent 13-F. This is a very light version of the custom portfolio audit we do for our institutional clients when we analyze their portfolios for torpedoes and companies they may want to “lean in” on.
See for yourself below.
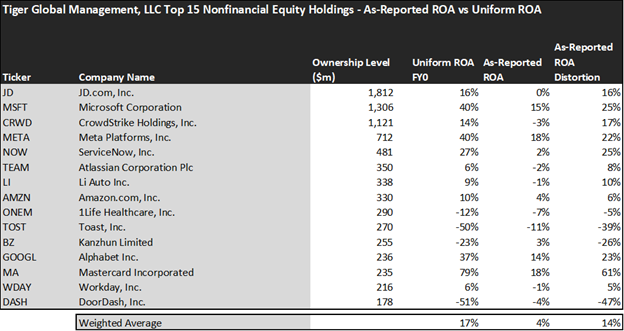
Using as-reported accounting, investors would think investing with Tiger Global is not that profitable.
On an as-reported basis, many of these companies are poor performers in terms of profitability with an average as-reported ROA of just 4%, which is way below the corporate averages in the United States.
However, once we make Uniform Accounting (UAFRS) adjustments to accurately calculate earning power, we can see that the returns of the companies in Tiger Global are much more robust.
The average company in the portfolio displays an average Uniform ROA of 16%, which is slightly above the corporate average returns.
Once the distortions from as-reported accounting are removed, we can realize that Microsoft (MSFT) doesn’t have a ROA of 15%, but returns of 40%.
Similarly, ServiceNow (NOW) ROA is actually 27%, not 2%. ServiceNow is an American software company based in Santa Clara, California that develops a cloud computing platform to help companies manage digital workflows for enterprise operations.
Mastercard (MA) is another great example of as-reported metrics misrepresenting the company’s profitability. With a Uniform ROA of 79%, an as-reported of 18% is wholly misleading and misses the story.
If investors were to look at the fund as powered by as-reported metrics, they would think that Tiger Global’s fundamental research strategies are not as successful and influential as it seems.
To find companies that can deliver alpha beyond the market, just finding companies where as-reported metrics misrepresent a company’s real profitability is insufficient.
To really generate alpha, any investor also needs to identify where the market is significantly undervaluing the company’s potential.
When distortions from as-reported metrics are removed, investors can see that Driehaus is actually doing a great job and they are highly successful. However, investors shouldn’t jump into the fund without considering the upside potential of such an investment.
Once we account for Uniform Accounting adjustments, we can see that many of these companies are strong stocks but have already realized most of their potential.
These dislocations demonstrate that most of these firms are in a different financial position than GAAP may make their books appear. But there is another crucial step in the search for alpha. Investors need to also find companies that are performing better than their valuations imply.
Valens has built a systematic process called Embedded Expectations Analysis to help investors get a sense of the future performance already baked into a company’s current stock price. Take a look:

This chart shows four interesting data points:
- The Uniform ROA FY0 represents the company’s current return on assets, which is a crucial benchmark for contextualizing expectations.
- The analyst-expected Uniform ROA represents what ROA is forecasted to do over the next two years. To get the ROA value, we take consensus Wall Street estimates and convert them to the Uniform Accounting framework.
- The market-implied Uniform ROA is what the market thinks Uniform ROA is going to be in the three years following the analyst expectations, which for most companies here is 2023, 2024, and 2025. Here, we show the sort of economic productivity a company needs to achieve to justify its current stock price.
- The Uniform P/E is our measure of how expensive a company is relative to its Uniform earnings. For reference, the average Uniform P/E across the investing universe is roughly 24x.
Embedded Expectations Analysis of Tiger Global paints a clear picture for investors. As the stocks it tracks are strong performers historically, analysts are pricing them to increase in profitability, while the market is even more optimistic.
While analysts forecast the fund to see Uniform ROA increase to 21% over the next two years, the market is pricing the fund to see returns increase to 25%, which may lead to some downside risk.
There are a couple of companies that may lead investors to be especially cautious.
The markets are pricing in DoorDash’s (DASH) Uniform ROA to rise to 29%. Meanwhile, analysts are projecting the company’s returns to collapse to -42%.
Atlassian Corporation (TEAM) may further disappoint investors as their returns are expected to increase to 52% Uniform ROA, while the analysts only expect them to improve returns to 20%.
To sum up, the portfolio is composed of strong performers and high-growth names that can deliver impressive returns, but investors should carefully analyze the current investment environment and valuations before making a strategic decision.
This just goes to show the importance of valuation in the investing process. Finding a company with strong growth is only half of the process. The other, just as important part, is attaching reasonable valuations to the companies and understanding which have upside which have not been fully priced into their current prices.
To see a list of companies that have great performance and stability also at attractive valuations, the Valens Conviction Long Idea List is the place to look. The conviction list is powered by the Valens database, which offers access to full Uniform Accounting metrics for thousands of companies.
Click here to get access.
Read on to see a detailed tearsheet of the fund’s largest holdings.
SUMMARY and JD.com, Inc. Tearsheet
As Tiger Global’s largest individual stock holding, we’re highlighting JD.com, Inc. (JD:USA) tearsheet today.
As the Uniform Accounting tearsheet for JD.com highlights, its Uniform P/E trades at 20.8x, which is around the global corporate average and below its historical average of 27.5x.
Average P/Es require average EPS growth to sustain them. In the case of JD.com, the company has recently shown -7% Uniform EPS growth.
Wall Street analysts provide stock and valuation recommendations that, in general, provide very poor guidance or insight. However, Wall Street analysts’ near-term earnings forecasts tend to have relevant information.
We take Wall Street forecasts for GAAP earnings and convert them to Uniform earnings forecasts. When we do this, JD.com’s Wall Street analyst-driven forecast is for EPS to grow by 12% and 60% in 2022 and 2023, respectively.
Based on the current stock market valuations, we can use earnings growth valuation metrics to back into the required growth rate to justify JD.com’s $55 stock price. These are often referred to as market embedded expectations.
The company is currently being valued as if Uniform earnings were to grow by 9% annually over the next three years. What Wall Street analysts expect for JD.com’s earnings growth is below what the current stock market valuation requires through 2023.
Meanwhile, the company’s earning power is 3x the long-run corporate averages. Also, cash flows and cash on hand exceed the total obligations—including debt maturities and capex maintenance. However, intrinsic credit risk is 50bps. All in all, these signal low credit risk.
Lastly, JD.com’s Uniform earnings growth is below peer averages, but is trading above its average peer valuations.
Best regards,
Rob Spivey
Director of Research at Valens Research


